FTTx facts and figures from around the world

global fttx


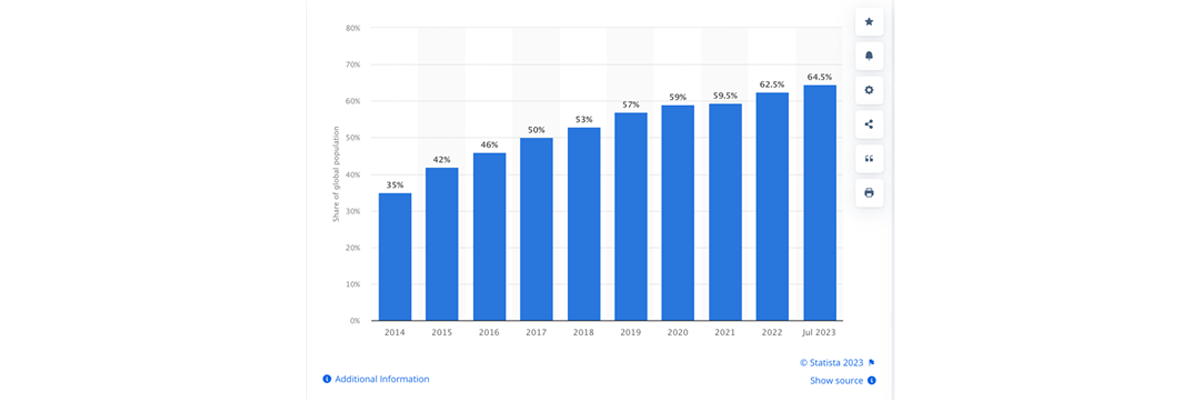
The reported number of global internet users grew 2.1 % over the past year, reaching 5.19 bn in July 2023. That’s 64.5% of the world’s population – although delays in information collection and processing mean this figure may be higher. Furthermore, there are currently 5.56 bn unique mobile subscribers around worldwide – 69.1% of the global population.

Source: GSMA Intelligence


Internet uptake accelerated during the pandemic. In 2019, 54% of the global population were using the Internet, whereas this amounted to some 66% (5.3 bn people) in 2022.

Source: ITU

The number of people using the Internet globally has doubled in less than a decade.

Source: Internet World Stats


Northern Europe has the world’s highest internet penetration rate (+97.3% of the population) followed by Western Europe (93.5%). As of January 2023, China - the world’s most populated country - had the highest number of internet users (1.05 bn). That’s more than three times as many as the USA, which comes third with some 311 m users. India, with 658 m users, holds second place. A third of online users worldwide are between 25 and 34 years old.

Source: Statista

The number of fixed broadband connections worldwide reached 1.377 bn at the end of March 2023, up by 83 m from a year earlier. The number of additional connections varies from quarter to quarter, but averages out at just over 20 m every three months. The global fixed broadband sector continues to grow at about 20 m new connections each quarter.

Source: Point Topic


Global internet usage growth from 1995 to 2022. The number of internet users increases at an average rate of 8.2% a year.

Source: Datareportal


Global median internet connection speeds are currently at 82.77 Mb/s Download and 37.53 Mb/s Upload. Singapore is the world leader at 254.65 Mb/s download, with Hong Kong a close second at 243.59 Mb/s.

Source: Speedtest.net

A closer look at mobile internet

Mobile data usage volume has doubled per subscription in four years, from 4.7 gigabytes per month to 10.4 in 2022.

Source: oecd.org


92% of all users access the internet through mobile phones. The total number of active mobile internet users is some 4.32 bn.

Source: Sysgen

A closer look at access disparity

Broadly speaking, higher GNI per capita indicates greater internet access at home for children and young people. Access varies widely depending on income group, household wealth, and country level of economic development. Worldwide, there’s a large difference in home internet access between children and young people in rural and urban areas

Source: UNICEF and the International Telecommunication Union (ITU)


Europe, North America and other developed regions tend to have higher penetration rates, usually exceeding 90% of the population. Developing regions such as Africa, Asia, and Latin America have penetration rates below 50% (often significantly lower).

Source: Desktrack


In the Least Developed Countries, over a quarter (28%) of the population in rural areas was online in 2022, compared with 52% of population in urban areas.

Source: ITU

A closer look at the Worldwide Fiber Market

The Global Fiber Optics Market, valued at US$ 4.94 bn in 2021, is expected to reach US$ 11.66 bn by 2030. The market is projected to grow at a 10.1% CAGR from 2022 to 2030.

Source: Verified Market Research®


Global FTTH market sales revenue is projected to be US$ 23.42 billion in 2023 and set to reach a valuation of US$ 95.88 billion by 2033.

Source: Future Market Insights


The global median price of mobile-broadband services dropped from 1.9% of average gross national income (GNI) per capita to 1.5 %.

Source: ITU
Source: Statista
Source: Statista