62
| 2012 annual report prysmian group
ENERGY BUSINESS
Sales were generally stable while profitability has increased.
(*) Includes the Draka Group’s results for the period 1 March – 31 December 2011.
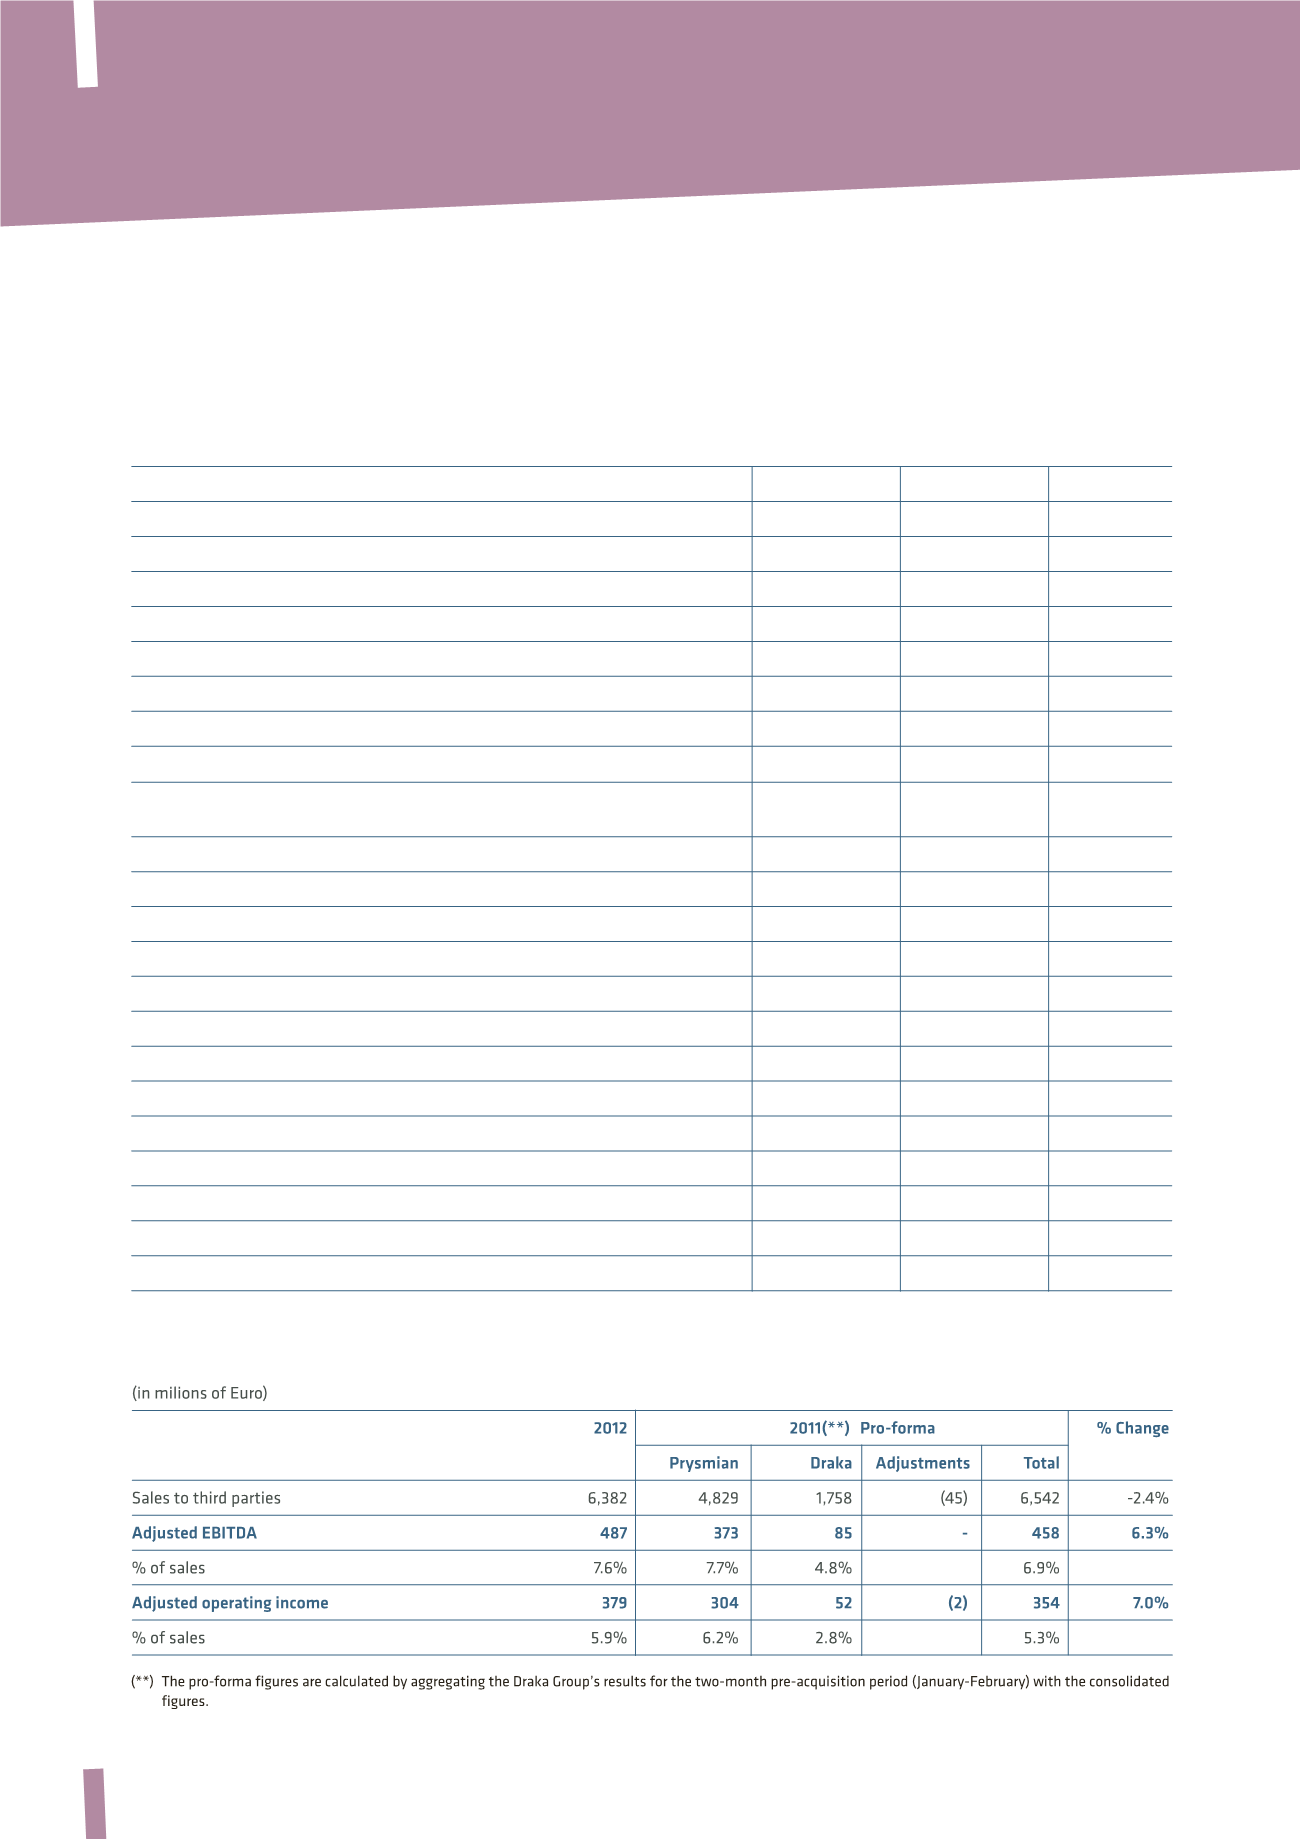
(in millions of Euro)
2012
2011 (*)
% Change
2010
Sales to third parties
6,382
6,268
1.8%
4,121
Adjusted EBITDA
487
447
8.9%
351
% of sales
7.6%
7.1%
8.5%
EBITDA
417
186
124.2%
339
% of sales
6.5%
2.9%
8.2%
Amortisation and depreciation
(108)
(99)
9.4%
(71)
Adjusted operating income
379
348
8.8%
280
% of sales
5.9%
5.5%
6.8%
Reconciliation of EBITDA to Adjusted EBITDA
EBITDA (A)
417
186
124.2%
339
Non-recurring expenses/(income):
Company reorganisation
53
42
10
Antitrust
1
205
3
Draka integration costs
4
2
-
Tax inspections
1
-
(2)
Environmental remediation and other costs
3
5
1
Italian pensions reform
1
-
-
Other non-recurring expenses
10
-
-
Release of Draka inventory step-up
-
8
-
Gains on disposal of assets held for sale
(3)
(1)
-
Total non-recurring expenses/(income) (B)
70
261
12
Adjusted EBITDA (A+B)
487
447
8.9%
351
Consolidated Financial Statements >
Directors’ Report


