78
| 2012 annual report prysmian group
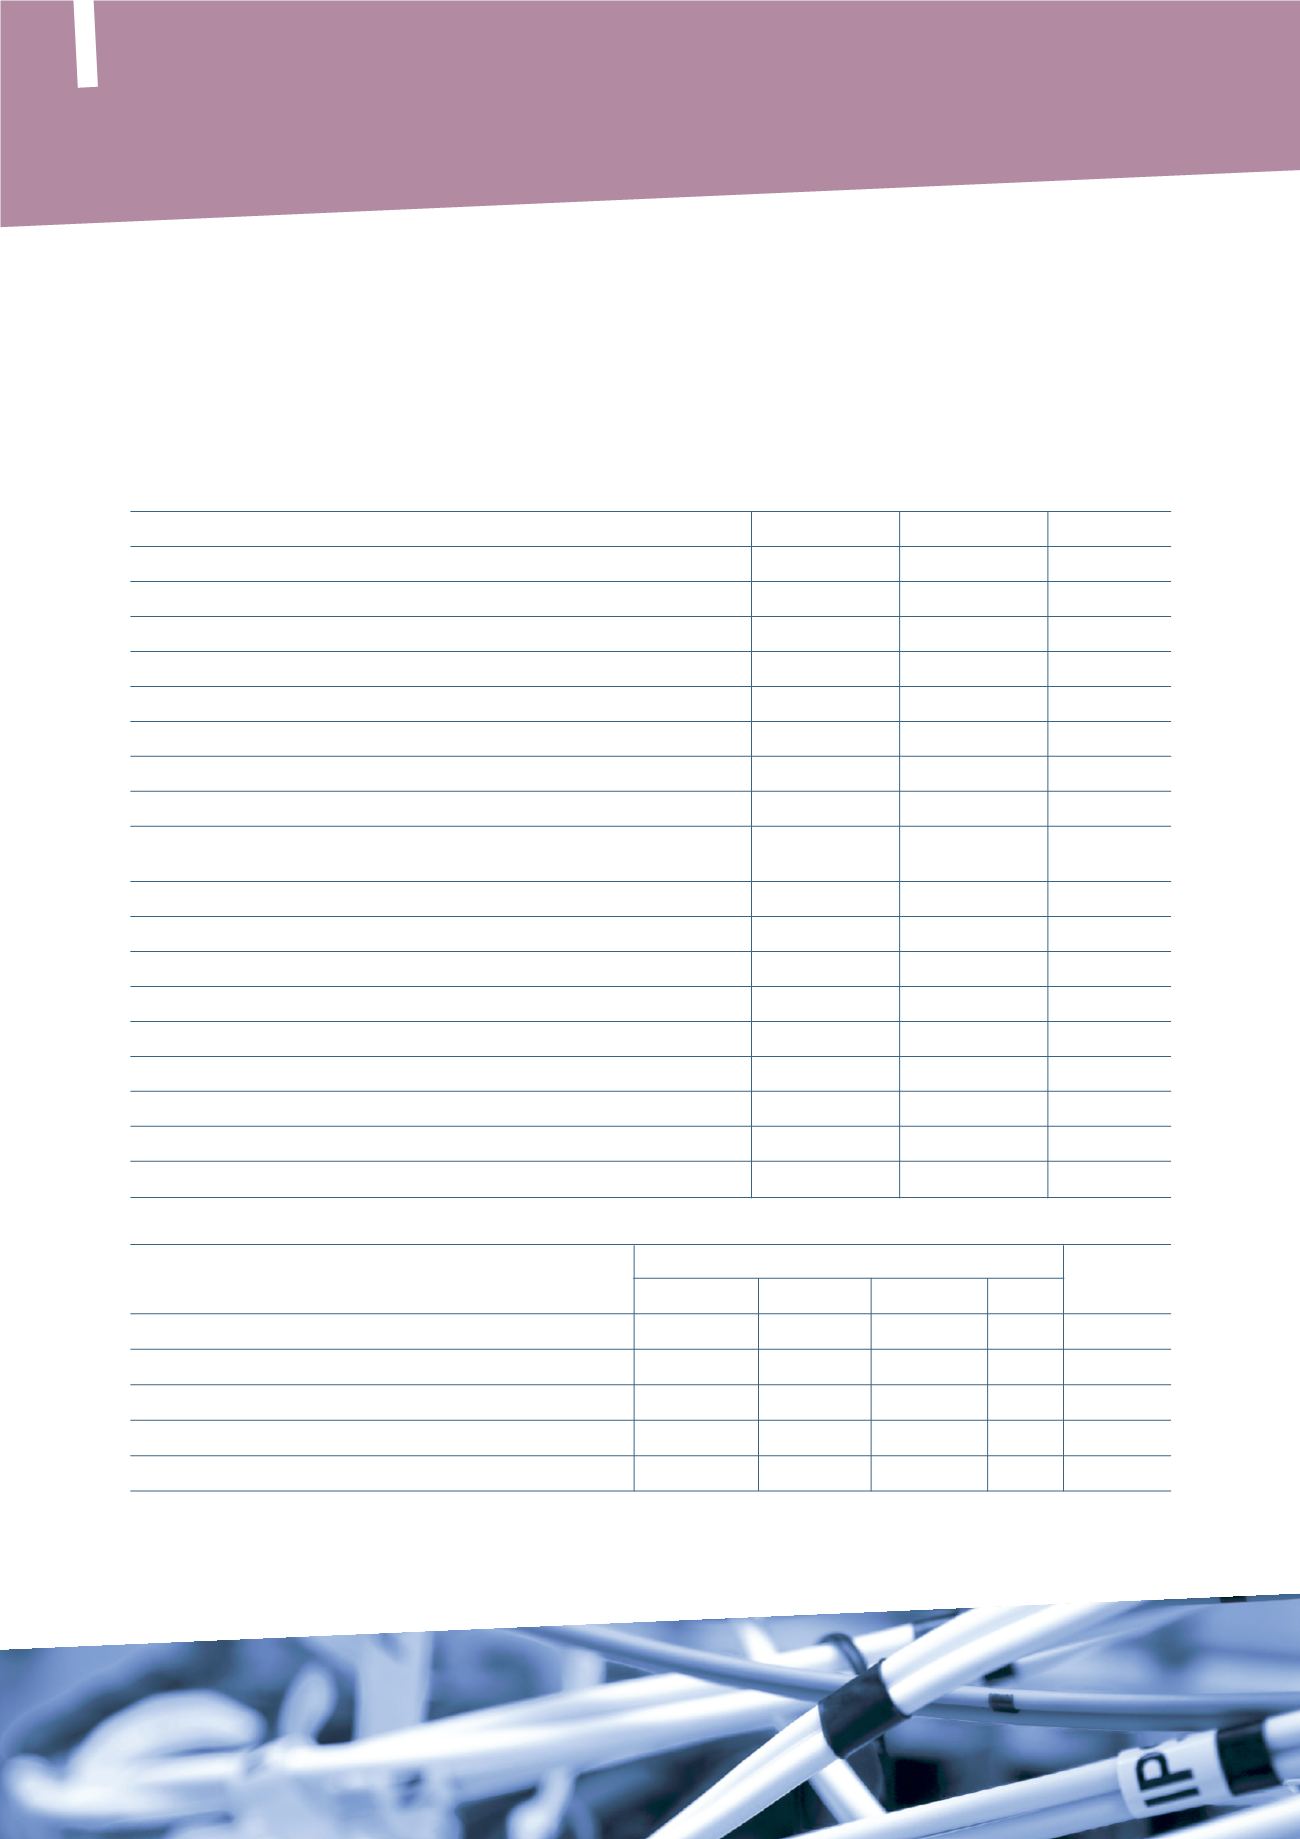
(in milions of Euro)
2012
2011 (*)
% Change
2010
Sales to third parties
1,466
1,315
11.5%
450
Adjusted EBITDA
160
121
32.1%
36
% of sales
10.9%
9.1%
7.9%
EBITDA
138
103
33.9%
36
% of sales
9.4%
7.7%
7.9%
Amortisation and depreciation
(56)
(43)
31.3%
(7)
Adjusted operating income
104
78
33.9%
29
% of sales
7.1%
5.8%
6.3%
Reconciliation of EBITDA to Adjusted EBITDA
EBITDA (A)
138
103
33.9%
36
Non-recurring expenses/(income):
Company reorganisation
16
12
-
Draka integration costs
1
-
-
Tax inspections
2
-
-
Other non-recurring risks
3
-
-
Release of Draka inventory step-up
-
6
-
Total non-recurring expenses/(income) (B)
22
18
-
Adjusted EBITDA (A+B)
160
121
32.1%
36
(in milions of Euro)
2012
2011(**) Pro-forma
% Change
Prysmian
Drak Adjustments
Total
Sales to third parties
1,466
534
911
(14)
1,431
2.4%
Adjusted EBITDA
160
46
82
-
128
24.9%
% of sales
10.9%
8.5%
8.8%
8.8%
Adjusted operating income
104
38
55
(12)
81
28.9%
% of sales
7.1%
7.0%
4.6%
5.6%
TELECOM BUSINESS
(*) Includes the Draka Group’s results for the period 1 March – 31 December 2011.
(**) The pro-forma figures are calculated by aggregating the Draka Group’s results for the two-month pre-acquisition period (January-February) with the
consolidated figures.
Consolidated Financial Statements >
Directors’ Report
In the key fibre sector, the Group is in the unique position of being able to use all existing
manufacturing processes within its own plants.


