45
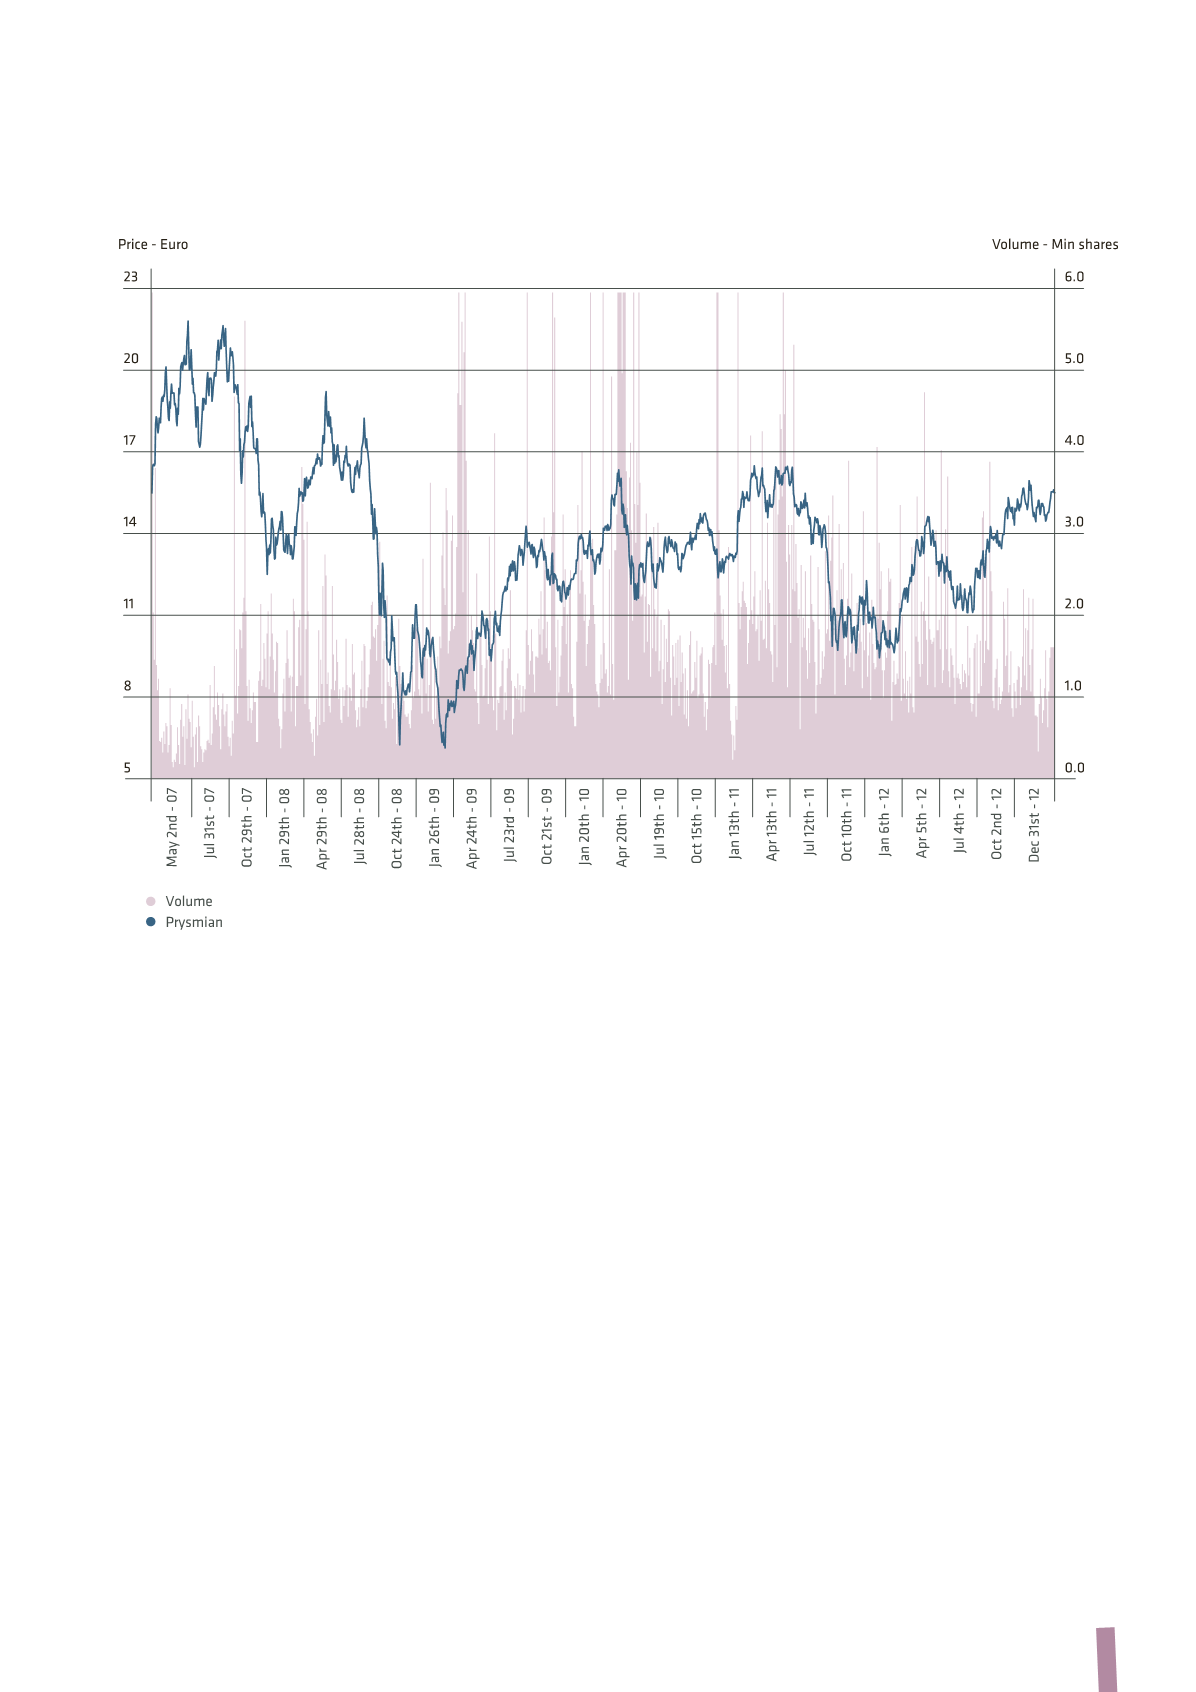
PERFORMANCE OF PRYSMian STOCK SINCE IPO
outperforming its competitors and benchmark indices,
thereby increasing its weight within such indices. The stock’s
performance, including dividend pay-outs (total shareholder
return), was a gain of +59% over the course of 2012 and +11%
since its listing date. The MSCI Europe Capital Goods index
reported a rise of 16% over the year and a fall of -24% since
Prysmian’s listing date, while the FTSE MIB was up 8% from
the start of the year but down -63% since the date of the
Company’s IPO. By way of reference, the principal financial
markets performed as follows in 2012: FTSE MIB: +8%, CAC 40
(France): +15%; IBEX (Spain): -5%; FTSE 100 (UK): +6%; DAX
(Germany): +29%; Dow Jones (US): +7%; S&P 500 (US): +13%;
Nikkei (Japan): +23%; MSCI Europe Capital Goods: +16%.
In particular, during the first quarter of 2012, the Prysmian
stock increased to more than Euro 14, as part of a positive
trend also seen, albeit to a lesser extent, in the major
European indices. In fact, thanks to the actions of the ECB, the
tensions on Eurozone financial markets eased considerably,
leading to a significant reduction in the risk premiums on
European government bonds.
However, from the month of March, there were renewed
concerns over the sustainability of debt levels in some
European countries, particularly Greece, and equity markets
gradually retreated, cancelling all the first-quarter gains by the
end of June. The Prysmian stock was impacted by the bearish
trend, falling to around Euro 11 in June. Thanks to strong
intervention by the ECB, global financial markets stabilised
from July and, in some cases, strengthened, despite the
general slowdown in the global economy and the worsening
outlook for future growth. In this context, the Prysmian
stock entered a positive phase, supported by the growth in
its results and the positive recommendations of financial
analysts, significantly outperforming all the stock indices
and returning to its 2007 listing price of Euro 15, at which
it stabilised in the last few months of the year, eventually
closing the year at Euro 15.01, up 56% from Euro 9.60 at the
end of 2011.
During 2012, the stock’s liquidity recorded an average daily
trading volumes of approximately 1.5 million shares, a
decrease compared with 2011 due to the general reduction
in volumes traded on European stock markets, particularly
in countries like Italy, that were hardest hit by financial
speculation. The average daily value traded amounted to Euro
20 million versus Euro 28 million in 2011.


