PARENT COMPANY >
FINANCIAL STATEMENTS AND EXPLANATORY NOTES
306
| 2012 annual report prysmian group
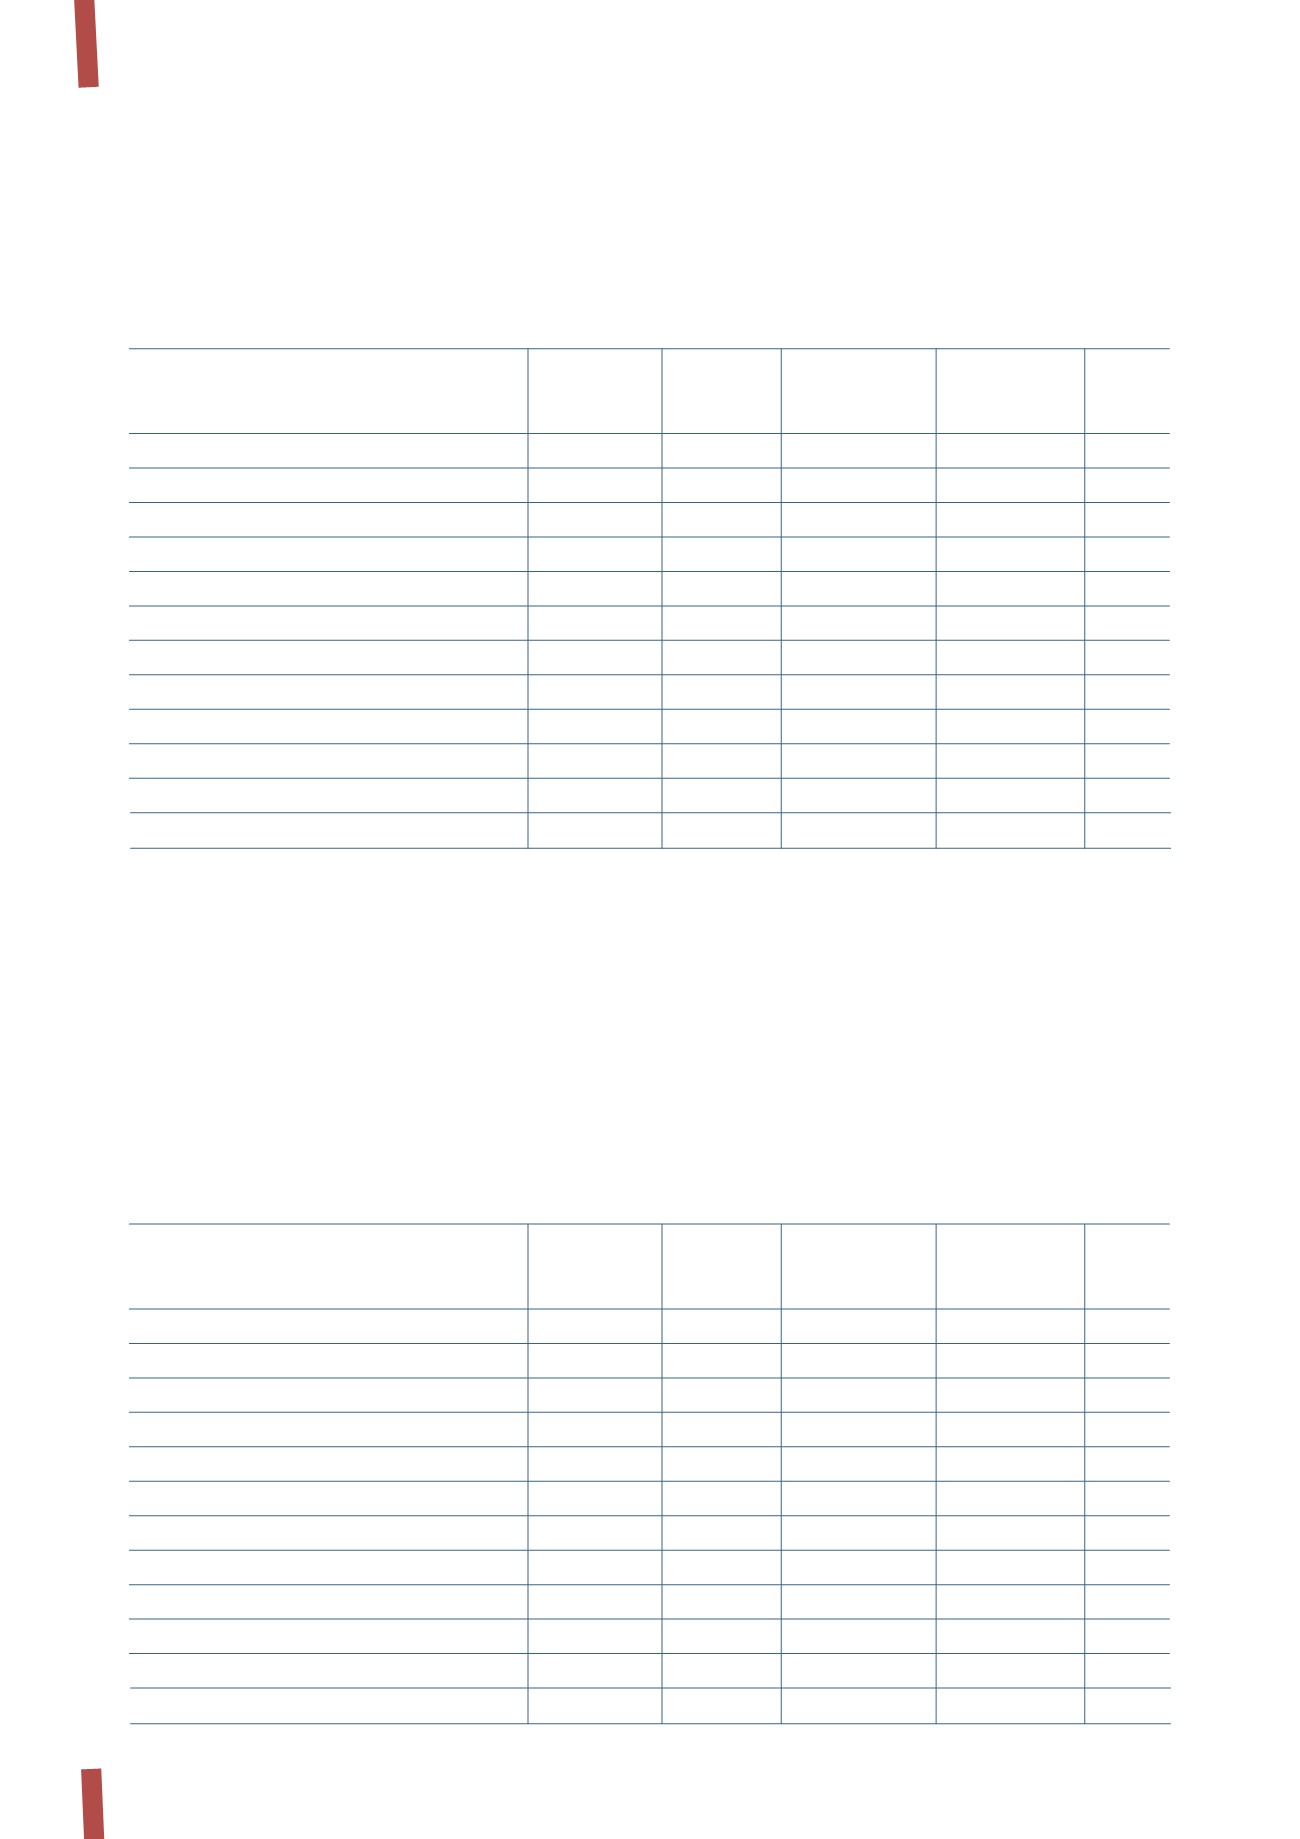
The following table presents the movements in property, plant and equipment over the course of 2012:
The amount of Euro 148 thousand for “Buildings” refers to
expenditure on properties taken under lease.
“Plant and machinery” (Euro 1,064 thousand) and “Equipment”
(Euro 325 thousand) mostly refer to instrumentation used for
Research and Development activities.
“Other assets” (Euro 1,463 thousand) comprise Euro 1,299
thousand in office furniture and equipment and Euro 164
thousand in motor and other vehicles.
1.
PROPERTY, PLANT AND EQUIPMENT
“Assets under construction and advances” (Euro 1,242
thousand) mostly refer to plant and machinery that will be
used for Research and Development and which are expected to
become available for use in the next year.
No borrowing costs were capitalised during the year.
Movements in property, plant and equipment in 2011 were as
follows:
(in thousands of Euro)
Buildings
Plant and
Equipment
Other
Assets under
Total
machinery
assets
construction
and advances
Balance at 31 December 2010
249
1,436
587
623
437
3,332
Movements in 2011:
- Investments
-
110
24
149
576
859
- Disposals
-
-
-
-
-
-
- Reclassifications
-
-
-
223
(223)
-
- Depreciation
(51)
(248)
(206)
(189)
-
(694)
Total movements
(51)
(138)
(182)
183
353
165
Balance at 31 December 2011
198
1,298
405
806
790
3,497
Of which:
- Historical cost
420
5,259
1,125
2.158
790
9,752
- Accumulated depreciation and impairment (222)
(3,961)
(720)
(1,352)
-
(6,255)
Net book value
198
1,298
405
806
790
3,497
(in thousands of Euro)
Buildings
Plant and
Equipment
Other
Assets under
Total
machinery
assets
construction
and advances
Balance at 31 December 2011
198
1,298
405
806
790
3,497
Movements in 2012:
- Investments
-
411
208
356
908
1,883
- Disposals
-
(461)
(162)
-
-
(623)
- Reclassifications
-
134
124
552
(456)
354
- Depreciation
(50)
(318)
(250)
(251)
-
(869)
Total movements
(50)
(234)
(80)
657
452
745
Balance at 31 December 2012
148
1,064
325
1,463
1,242
4,242
Of which:
- Historical cost
420
5,272
1.270
3,086
1,242
11,290
- Accumulated depreciation and impairment (272)
(4,208)
(945)
(1,623)
-
(7,048)
Net book value
148
1,064
325
1,463
1,242
4,242


