


 97 / 172

Prysmian Group – 2015 Sustainability Report
Prysmian’s People
________________________________________________________________________________________________
97
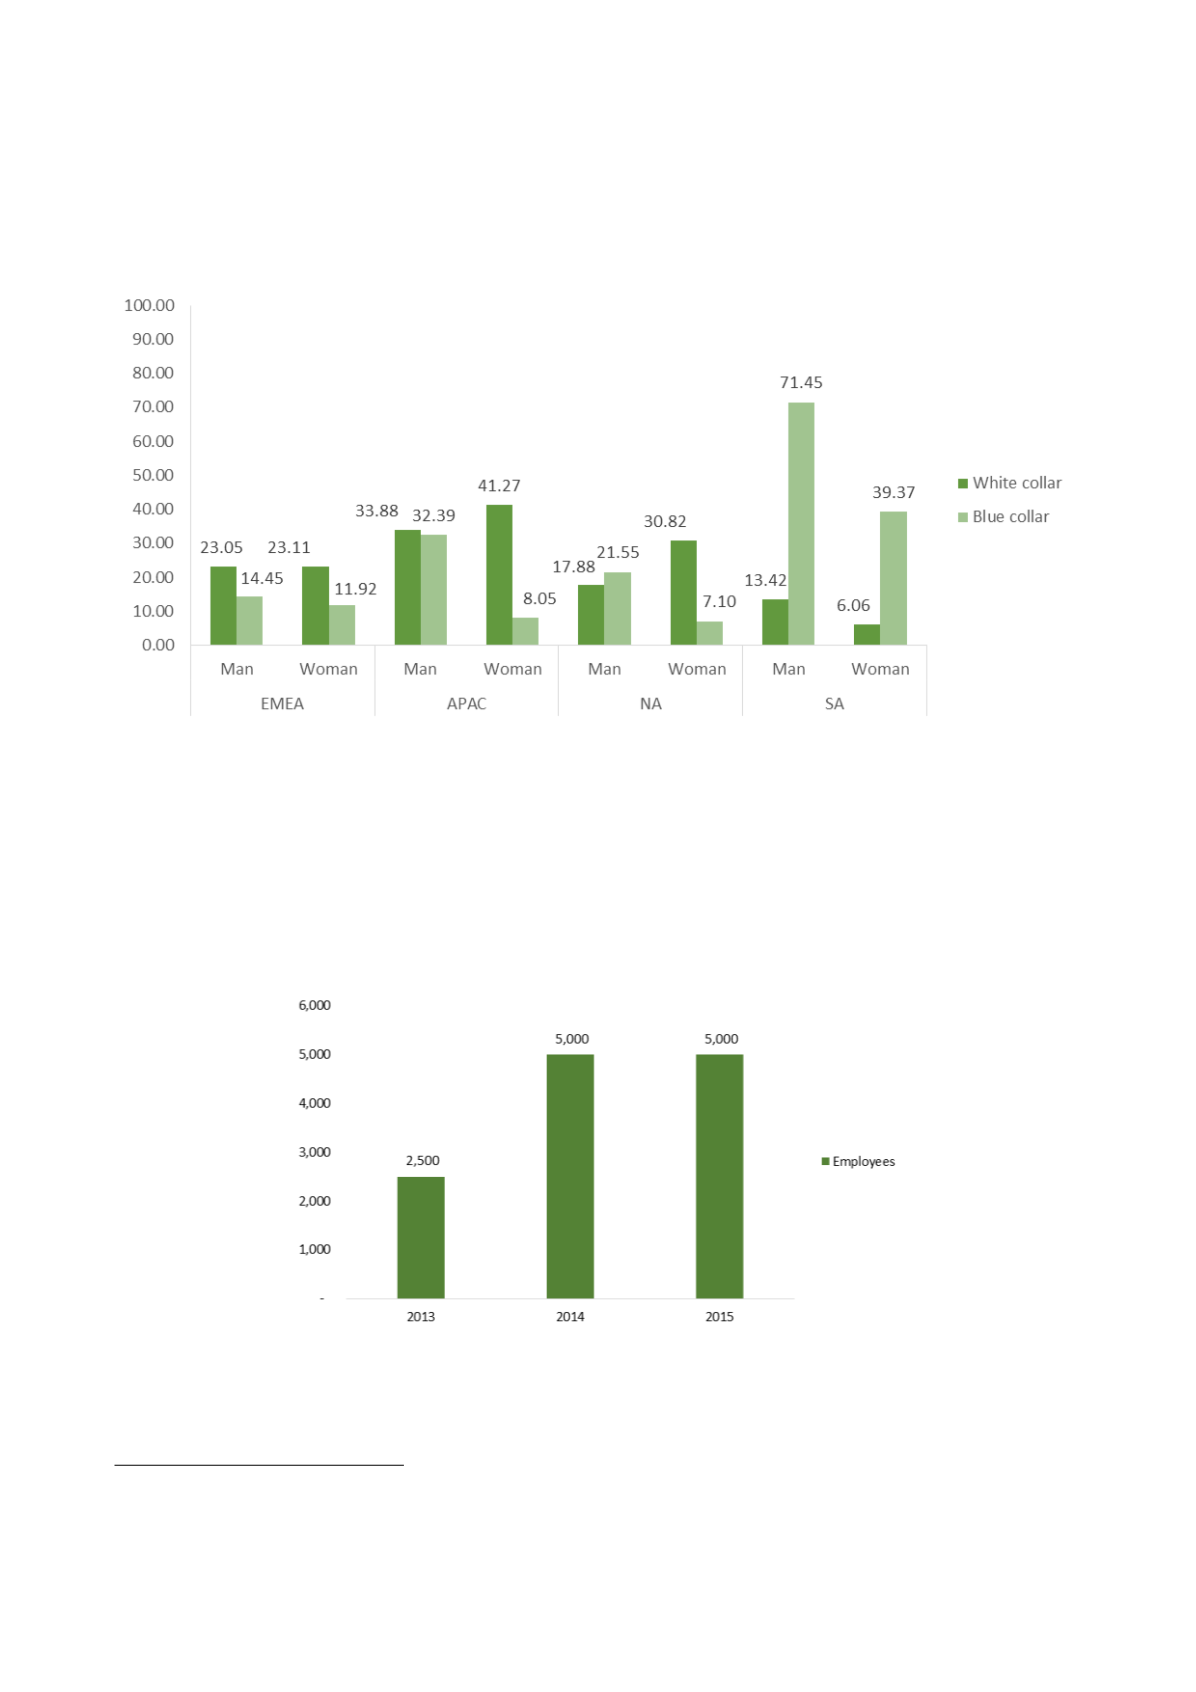
PER CAPITA TRAINING HOURS
18
BY EMPLOYEE CATEGORY AND GENDER
The chart
19
shows the per capita training hours delivered at some of the Group's main locations during 2015.
The training offer includes courses on issues such as health and safety, anti-corruption and human rights.
.
COMPANY POPULATION INVOLVED IN THE P3 PRYSMIAN PEOPLE PERFORMANCE PROGRAMME
The graph shows that the company population involved in the P3 programme has increased significantly
between 2013 and 2014, peaking at 5,000 participants in 2014. This number was maintained in 2015 and
corresponded to almost all of the white-collar population.
18
Headcount data at year-end, including solely the employees of companies that are Group subsidiaries or subject to management and
control. This data represents 100% of total employment by the Prysmian Group.
19
The following countries are included: EMEA (Turkey, the UK, Sweden, Denmark, Romania, Spain, Estonia, Russia, Finland, Italy,
Norway, Slovakia, Hungary, Germany), APAC (Thailand, the Philippines, Malaysia and Indonesia), NA (US, Canada, Mexico), SA
(Brazil).