


 78 / 172

Prysmian Group – 2015 Sustainability Report
Supply Chain
________________________________________________________________________________________________
78
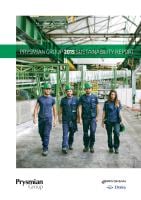
52%
24%
24%
Purchase of base metals
Purchase of raw materials
Purchase of non-raw
materials
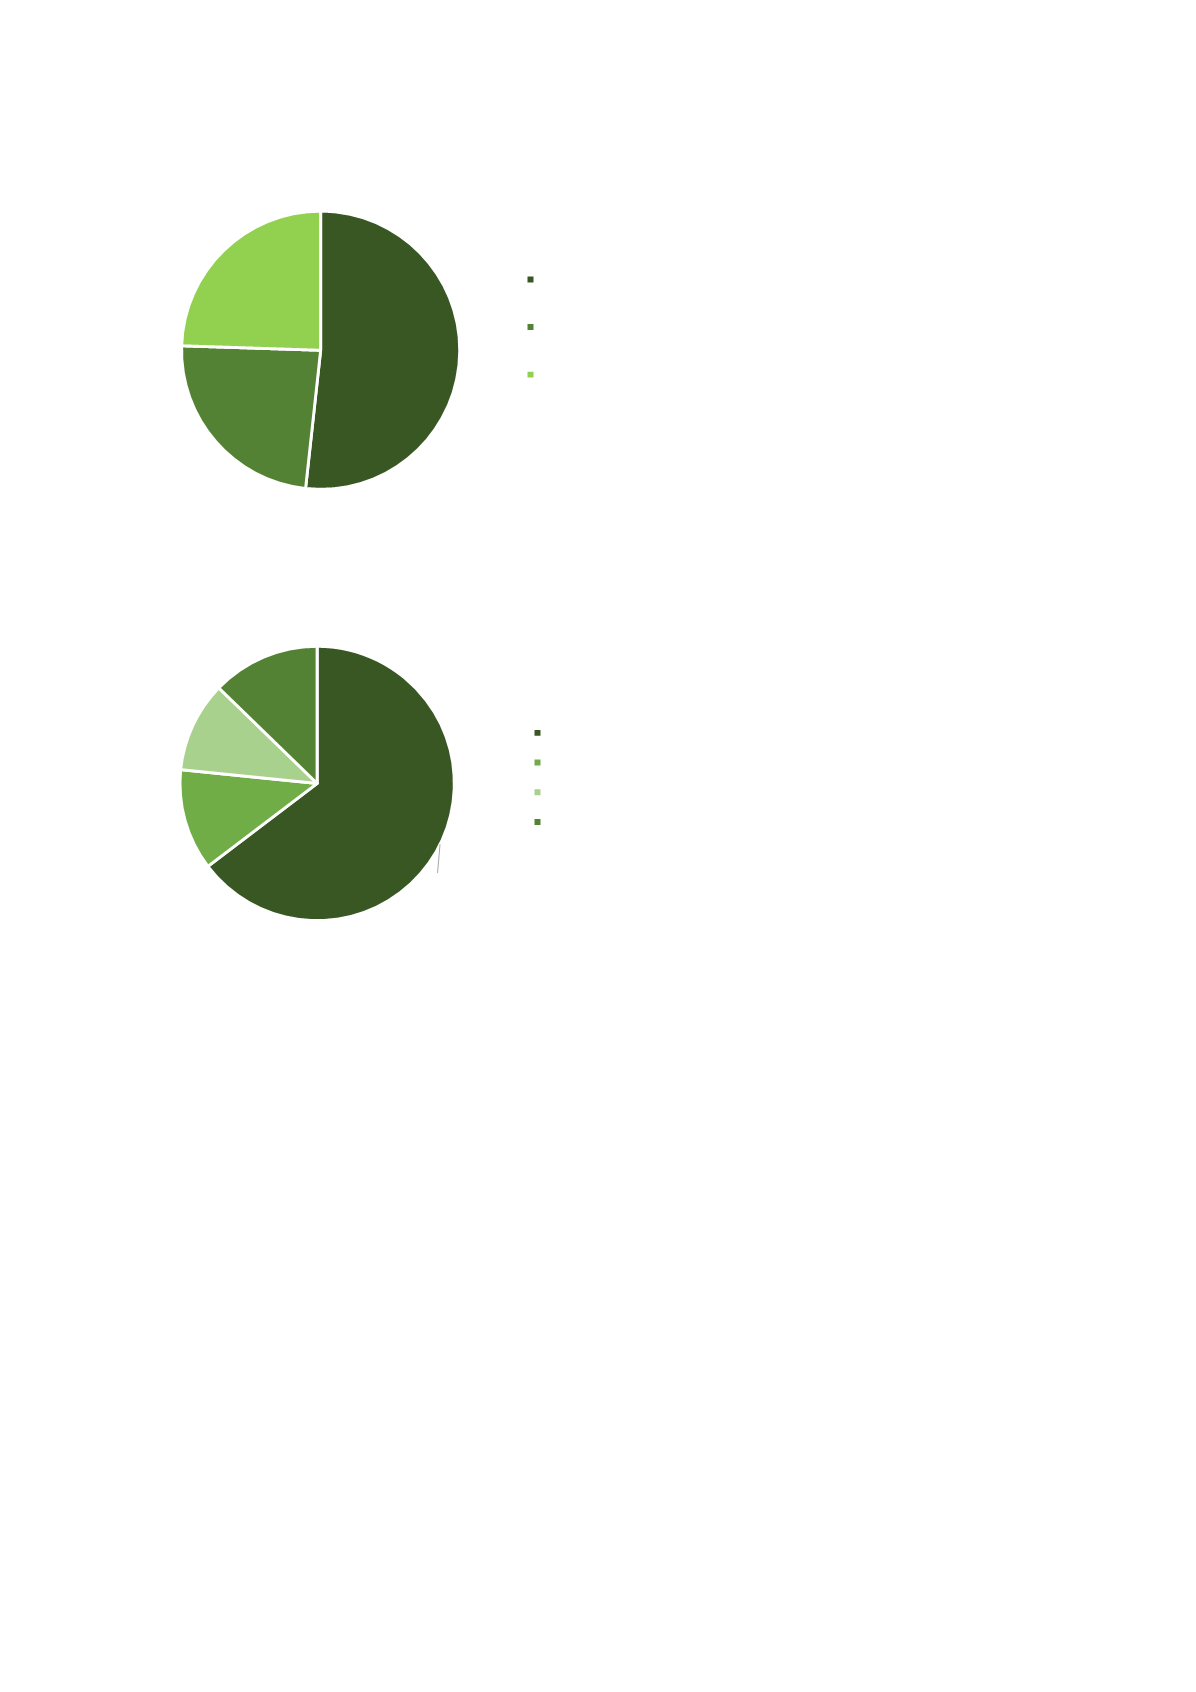
64.7%
11.9%
10.7%
12.7%
EMEA
North and Central America
Latin America
APAC
Total purchases by type in 2015
In 2015, 52% of total Group
purchases are related to “base
metals”, with the remaining split
between “raw materials” and “non-
raw materials”.
Total number of suppliers broken down by geographical area in 2015
In 2015, out of 5,024 suppliers of
“base metals” and “raw materials”,
64.7% are located in the EMEA
area, in line with 2014 data. The
remaining is split almost equally
among the other geographical
areas.
Percentage of goods and services purchased locally in 2015