


 149 / 172

Prysmian Group – 2015 Sustainability Report
Attachments
________________________________________________________________________________________________
149
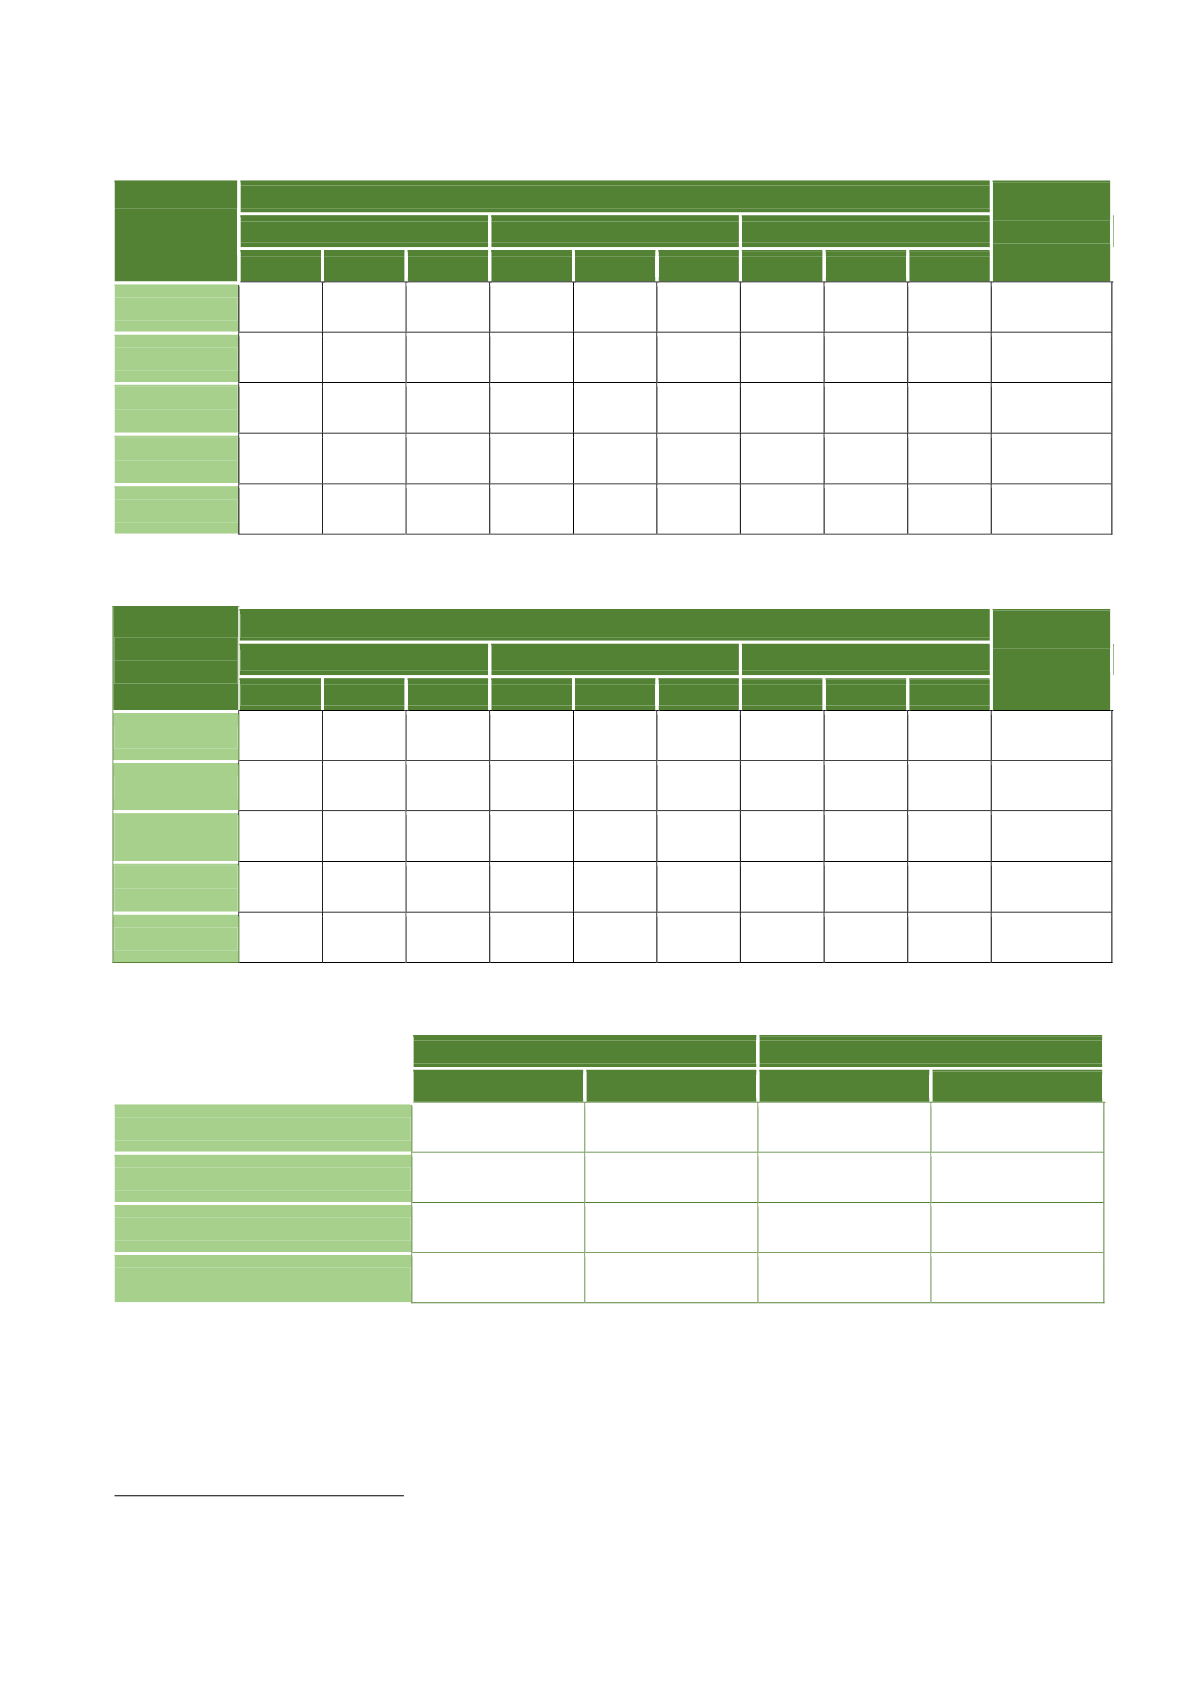
New hires broken down by age, gender and geographical area
36
No.
persons
New hires
Total
<30
31-50
>50
Men
Women
Total
Men
Women
Total
Men
Women
Total
APAC
30
18
48
46
37
83
7
2
9
140
EMEA
58
32
90
93
36
129
12
7
19
238
North
America
9
10
19
14
12
26
8
4
12
57
South
America
10
4
14
11
2
13
1
0
1
28
Total
107
64
171
164
87
251
28
13
41
463
Voluntary terminations boken down by age, gender and geographical area
37
No.
persons
Voluntary terminations
Total
<30
31-50
>50
Men
Women
Total
Men
Women
Total
Men
Women
Total
APAC
10
11
21
12
14
26
2
3
5
52
EMEA
13
7
20
43
19
62
13
7
20
101
North
America
2
5
7
11
7
18
7
2
9
34
South
America
5
0
5
2
6
8
2
0
2
15
Total
30
23
53
68
46
114
24
12
36
202
Frequency and severity rate of accidents broken down by geographical area
2014
2015
Frequency rate
Severity rate
Frequency rate
Severity rate
APAC
1.08
21.4
0.97
43.15
EMEA
3.29
54.2
3.70
61.07
North America
0.43
35.93
0.33
11.93
South America
5.13
89.4
3.38
83.13
36
Data expressed in FTE (Full Time Equivalents), including the employees and temporary staff of companies that are Group
subsidiaries or subject to management and control.
37
Data expressed in FTE (Full Time Equivalents), including the employees and temporary staff of companies that are Group
subsidiaries or subject to management and control.