


 145 / 172

Prysmian Group – 2015 Sustainability Report
Attachments
________________________________________________________________________________________________
145
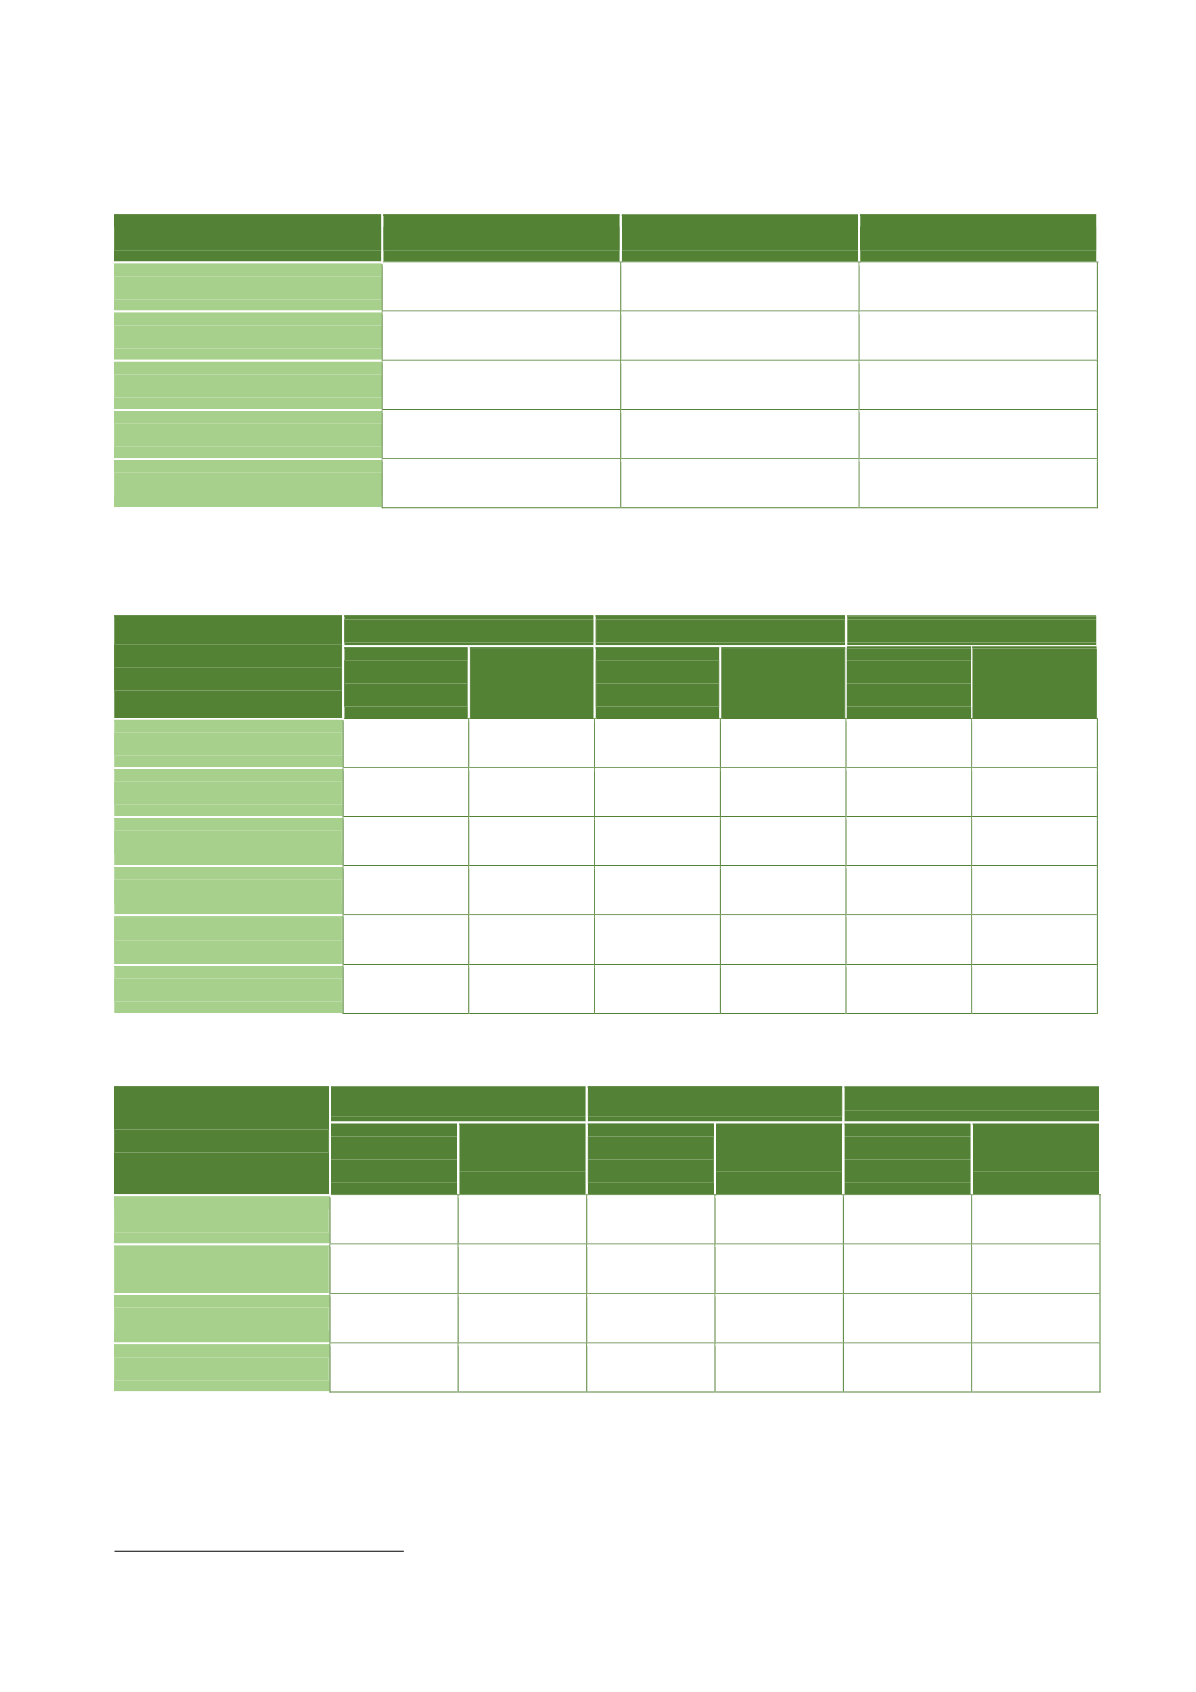
SUPPLY CHAIN
Total number of Prysmian Group suppliers broken down by geographical area as of 31 December
31
Geographical area
2013
2014
2015
EMEA
3,446 (65.1%)
3,472 (66.1%)
3,248 (64.7%)
North and Central America
571 (10.8%)
593 (11.3%)
600 (11.9%)
Latin America
599 (11.3%)
566 (10.8%)
536 (10.7%)
APAC
676 (12.8%)
621 (11.8%)
640 (12.7%)
Total
5,292
5,252
5,024
Total raw materials purchased by the Group, broken down by type of raw material and percentage of
raw materials used that derive from recycled materials as of 31 December
Raw materials
purchased
2013
2014
2015
Volume
(Ktonne)
% from
recycled
materials
Volume
(Ktonne)
% from
recycled
materials
Volume
(Ktonne)
% from
recycled
materials
Metals
652
21.47%
721
19.42%
675
19.61%
Compounds
237
0.42%
242
0.45%
231
0.29%
Ingredients
225
-
235
-
227
-
Chemical products
12
0.13%
6
0.25%
5
0.20%
Other (paper, yarns,
tapes, oil)
17
-
19
-
17
-
Total
1,143
12.34%
1,223
11.54%
1,155
11.52%
Local purchases out of total purposes (Mil €)
Geographical area
2013
2014
2015
Total
purchases
Purchases
from local
suppliers
Total
purchases
Purchases
from local
suppliers
Total
purchases
Purchases
from local
suppliers
EMEA
920
662 (72%)
920
662 (72%)
944
737 (78%)
North and Central
America
111
84 (76%)
111
84 (76%)
124
103 (83%)
Latin America
103
81 (79%)
103
81 (79%)
86
73 (84%)
APAC
71
55 (77%)
71
55 (77%)
97
77 (80%)
31
Data only considers suppliers of base metals and raw materials.