


 131 / 172

Prysmian Group – 2015 Sustainability Report
Environment
________________________________________________________________________________________________
131
Waste
The main types of waste generated by productive activities have been split into specific categories,
classifying their level of danger (hazardous waste and non-hazardous waste) according to the related
classification system, regardless of the waste's country of origin and disposal. An exception is made for
certain types of waste, such as laboratory chemicals. In such cases, waste is classified in one category or
the other depending on local laws and regulations.
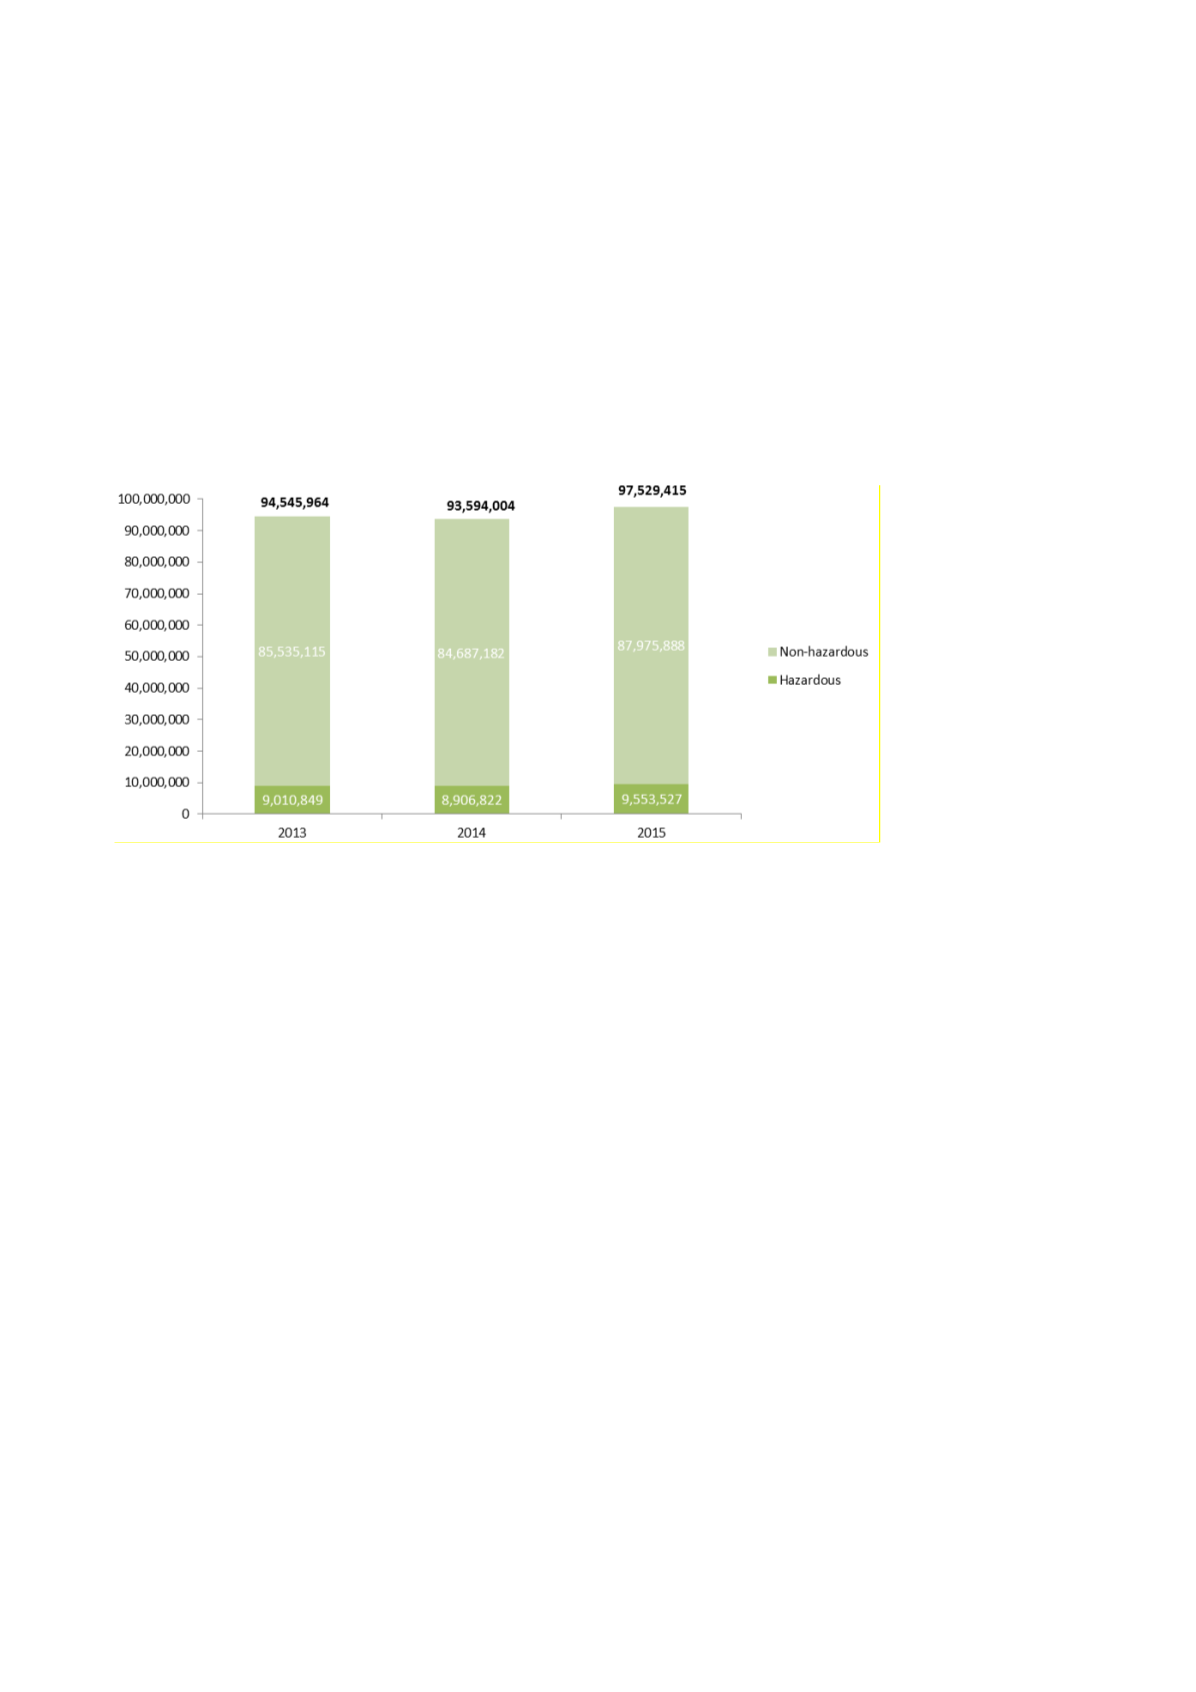
Total waste disposed in 2015 amounted to 97,529,415 Kg, which ncreased over last year.
WASTE DISPOSED BY TYPE (Kg)
Total hazardous waste disposed by the Group amounted to 9,553,527 Kg, which was 7.3% more than in the
previous year. This increase was largely due to an increase in the waste produced by the optical fibre
category.
With regard to the increase in hazardous waste disposed in the Energy Cables category, the opening of a
mixing plant in Spain during 2015 resulted in a need to perform various test, which generated an exceptional
quantity of waste. In addition, waste was generated at the construction site and in connection with the
installation of equipment. Lastly, again in the Energy Cables sector, an increase in waste was caused by the
number of factories that cleaned drawing tanks and other machinery, which is not necessarily an annual
activity and depends on production and quality requirements.
One factory’s accessories department was closed during 2015, resulting in an exceptional volume of
disposals and a spike in the graph of hazardous waste disposed by the accessories category.
The same graph shows a reduction in relation to the Telecom Cables sector. This was partly due to different
manufacturing requirements (e.g. smaller quantities of coloured fibres with respect to non-coloured fibres,
with a lower usage of solvents) and, in part, to the use of colours that fix better, thus reducing the quantity of
solvents used for cleaning. In other cases, this trend was caused by a reduction in waste oils as a
consequence of maintenance repairs.