Sustainability targets: the Scorecard

THE TARGETS FOR 2022

Setting goals and monitoring progress is essential to creating a credible path towards sustainability. Our Sustainability Scorecard lays out a concrete and measurable action plan that enables us to manage social, economic and environmental impacts as a part of our business activities.

The sustainability scorecard

The Scorecard’s three-year targets are based on the business perimeter of Prysmian and aligned with the 17 UN Sustainable Development for 2030. The Scorecard reflects criteria from the Global Reporting Initiative (GRI), and feedback from our stakeholders about the most important issues to them, as reflected in our Materiality Analisys.

Using 2019 as a point of reference, 2022 was the target year for achieving the established goals. The percentage reductions in GHG emissions (Scope 1 and 2 Market-Based) and energy consumption are calculated with reference to the 2019 baseline, consistent with the Science Based Targets initiative. All other KPIs refer to performance recorded on an annual basis.

The concrete and measurable action plan resulting from our Scorecard incorporates ESG aspects considered important by the sustainability indexes to which we belong; the requirements identified by our stakeholders, and the Key Performance Indicators linked to Prysmian Group’s Remuneration Policy.

The entire process is monitored by the Sustainability Steering Committee, which is chaired by the Chief Sustainability Officer of the Group. These results are also agreed with and monitored by the Sustainability Committee established within the Board of the Group during 2020.

The Sustainability Scorecard includes 16 challenging targets to be met by 2022. Although in 2021 the Group set two new strategic ambitions — Climate Ambition and Social Ambition — and defined new medium-to long-term targets, it has decided to continue to disclose the Scorecard indicators in line with the previous years, so as to guarantee the utmost transparency to all of its stakeholders.

Our Sustainability Scorecard

scorecard


KPI: Percentage of product families covered by the carbon footprint measurement1

Baseline 2019: 70%

2020: 84%

2021: 89%

2022: 92%

Taget 2022: 85%


1. The value takes into account possible changes in the product portfolio, and consequently in the number of items, of the former General Cable area.

KPI: Percentage of annual revenues from low carbon-enabling products2

Baseline 2019: 48%

2020: 48%

2021: 44%

2022: 45%

Taget 2022: 48% to 50%


2. The figure was calculated on the sales at 31 December 2021 of the various business areas of Prysmian Group. The business areas, or part of them — considered as “low carbon enabling” — were identified by applying the taxonomy developed by the Climate Bond Initiative (CBI taxonomy).

KPI: Percentage reduction of GHG emissions (Scope 1&2 Marked Based) vs 2019 baseline(3)3

Baseline 2019: 870 ktCO24

2020: -17.4%

2021: -22.1%

2022: -24%

Taget 2022: -16% to -21%


KPI: Percentage reduction in energy consumption

Baseline 2019: 9.845 TJ5

2020: -6%

2021: -2.9%

2022: -7.7%

Taget 2022: -3%


KPI: Percentage of plants certified ISO 14001

Baseline 2019: 83%

2020: 83%

2021: 90%

2022: 97%

Taget 2022: 95%


3. Prysmian Group has defined its SBTs and decided to set market-based emission targets. Its 2022 targets, as well as its 2021 and prior year performances have thus been updated accordingly.
4. Relates to the fully-consolidated perimeter, including the plants in Chiplun (India) and Sohar (Oman).
5. Relates to the fully-consolidated perimeter, excluding the plants in Chiplun (India), Sohar (Oman) and the Group’s fleet.

KPI: Percentage of waste recycled

Baseline 2019: 63%5

2020: 69%

2021: 69%

2022: 71%

Taget 2022: 65%


KPI: Percentage of drums (tonnes) reused during the year

Baseline 2019: 46%

2020: 48%6

2021: 50%

2022: 50%

Taget 2022: Maintain


KPI: Number of sustainability audits carried out based on risks in the supply chain

Baseline 2019: 15

2020: 22

2021: 27

2021: 30

Taget 2022: 30


KPI: Percentage of cables assessed using Ecolabel criteria developed internally by Prysmian

Baseline 2019: 0%

2020: 1%

2020: 20.9%

2020: 37%

Taget 2022: 20%


5. Relates to the fully-consolidated perimeter, excluding the plants in Chiplun (India), Sohar (Oman) and the Group’s fleet.
6. Data restated, as indicated in the 2020 NFD.

KPI: Employee Engagement Index (EI)7

Baseline 2019: EI: 65%

2020: EI: 65%

2021: 60%

2022: 61%

Taget 2022: EI: 67% to 70%


KPI: Leadership Impact Index (LI)7

Baseline 2019: LI: 57%

2020: LI: 57%

2021: LI: 54%

2021: LI: 55%

Taget 2022: LI: 59% to 65%


KPI: Average hours of training per employee each year8

Baseline 2019: 26 hours

2020: 18 hours

2021: 18 hours

2022: 29 hours

Taget 2022: 30 hours


7. The Engagement Index is considered a result greater than or equal to 5 — on a scale from 1 (low) to 7 (high) — on two questions of a survey that measures employee engagement; the Leadership Impact Index is considered a result greater than or equal to 5 — on a scale from 1 (low) to 7 (high) — on five questions of a survey that measures employee engagement. The indices were developed in collaboration with SDA Bocconi.
8. Training hours include both local training and the Academy.

KPI: Percentage of women executives

Baseline 2019: 12%

2020: 13%

2021: 13.5%

2022: 15.7%

Taget 2022: 14% to 18%


KPI: Percentage of white collar women with permanent contracts

Baseline 2019: 33%

2020: 34%

2021: 39%

2022: 44.9%

Taget 2022: 40%

KPI: Frequency rate (IF) - Internal employees9

Baseline 2019: IF: 1.30

2020: IF: 1.30

2021: IF: 1.49

2022: IF: 1.32

Taget 2022: IF: 1.2


KPI: Frequency rate (IF) - Internal and external employees10

Baseline 2019: IF: 1.31

2020: IF: 1.25

2021: IF: 1.55

2022: IF: 1.40


KPI: Severity rate (IG) - Internal employees 9

Baseline 2019: IG: 41.54

2020: IG: 46.40

2021: IG: 46.98

2022: IG: 54.20

Taget 2022: IG: 41


KPI: Severity rate (IG) - Internal and external employees10

Baseline 2019: IG: 41.94

2020: IG: 44.76

2021: IG: 47.19

2022: IG: 53.46


9. The data includes only Prysmian employees and not external staff and does not include the Prysmian Group fleet. In 2019 and 2020, however, the data includes only Prysmian employees, not external staff and not the Group’s fleet.
10. The data includes Prysmian Group employees and external staff. It does not include the Prysmian Group fleet. 2019 and 2020 figures do not include the Group’s fleet.

The new Sustainability Scorecard

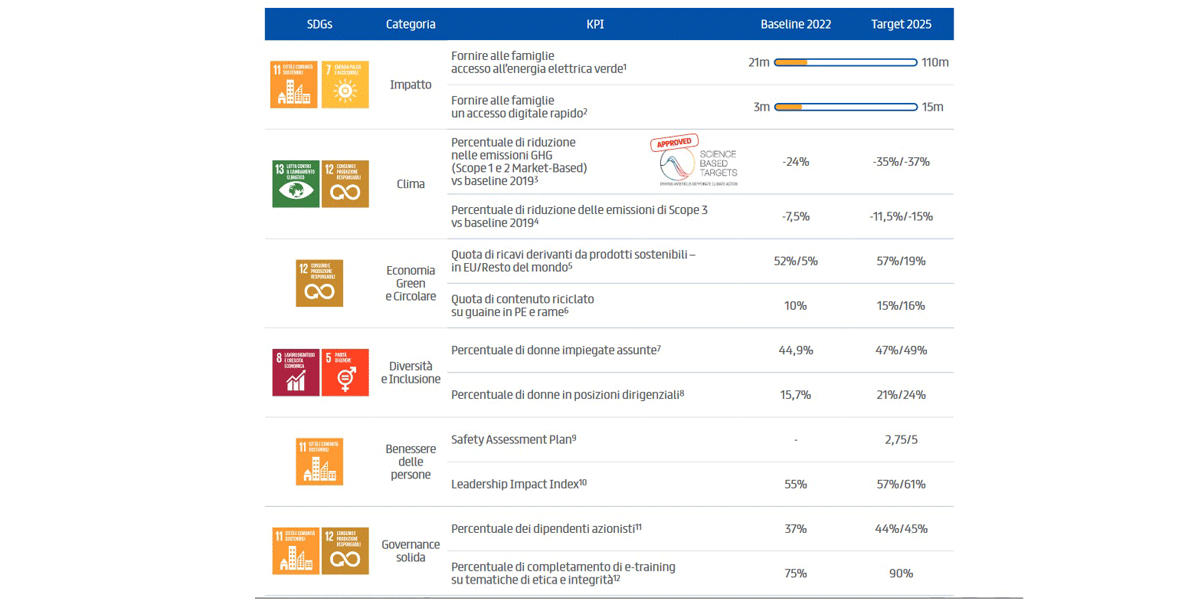
Commencing from the end of 2022, Prysmian has defined a new three-year scorecard (2023-2025, baseline 2022), revising and simplifying the KPIs used (11 impact KPIs) to make the measurement, monitoring and communication of results more effective. These were defined after an analysis of:

Prysmian ambitions (Social and Climate Change Ambitions);

  • UN Sustainable Development Goals;
  • GRI Standards;
  • New process for carrying out the Materiality Analysis

The value referring to the percentage reduction in GHG emissions (Scope 1 and 2) and in the value chain (Scope 3) is calculated with respect to the 2019 baseline (870 ktCO2 and 291 mtCO2), in accordance with the methodology of the Science Based Targets initiative (SBTi). All other KPIs refer to the annual performance.

The Scorecard is built on 3 pillars strategic for the entire Group - Environment, People-Community and Innovation - that, in turn, are subdivided into various categories: