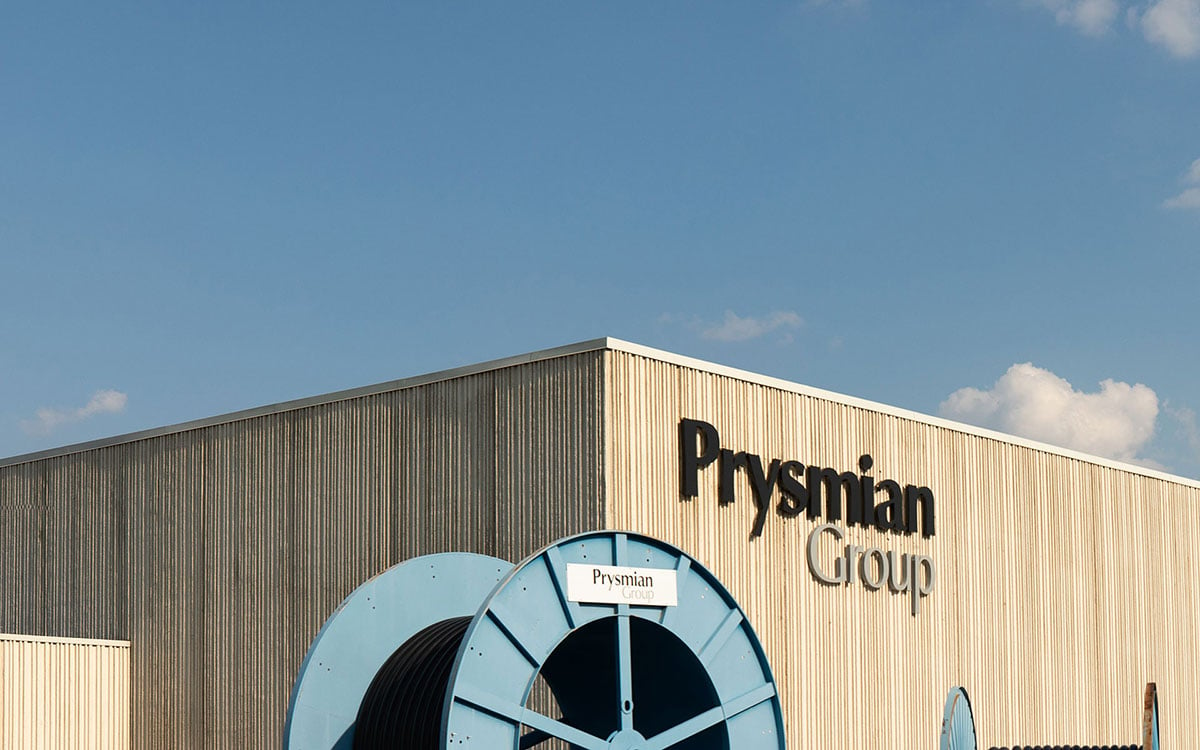
Creating Value
through Sustainability
Why an integrated report
Prysmian Group’s Integrated Annual Report, published for the first time, is a tool for presenting both financial and non-financial data. This decision marks a new approach to corporate reporting and highlights the daily efforts made by the Group to embed sustainability into all business strategies, as well as its role as an enabler of the energy transition and digitalisation processes. The Report explains the Group’s ability to create both financial and non-financial value over time, in the context and markets in which it operates.
This document is prepared in digital format and does not represent the official and compliant version of the applicable laws and regulations, for which please refer to the official documents available at the following link:
Integrated Annual Report 2022
Integrated Annual Report 2022
CEO’s letter to Stakeholders

The urgency of achieving the energy transition from fossil to renewable sources and electrification was even more evident in 2022, both in terms of speeding up decarbonisation and reducing Europe's dependence on natural gas and oil exporting countries.
It is increasingly clear that developing adequate grid infrastructure is crucial to exploit wind and solar power and support the conversion to electrification in critical sectors.
Cable technology plays a strategic role in this scenario, and sustainable growth for the environment and individuals is a priority. We are proud of the company's significant progress in nearly all ESG areas in 2022, including a -24% decline in Scope 1 and 2 emissions and a -7% decrease in Scope 3 emissions as we implement our Climate Ambition adopted in 2021.
The company is also committed to circularity, with 70.8% of total waste being recycled. The company's technologically innovative products, such as the P-Laser power cable made entirely from recycled materials, are widely recognized by utilities and TSOs.
The company is also focused on a Social Ambition centered on inclusivity, with a 15.7% increase in women in executive positions in 2022 and various initiatives promoting inclusion.
The year was marked by outstanding results, with total economic value generated at €16.71 billion (compared to €13.48 billion in 2021) and a Total Shareholder Return of +215.6%. In light of record results in 2022, we adopted new policies and tools for redistributing value to all stakeholders and engaging all employees, not just top managers.
Valerio Battista
CEO Prysmian Group
Highlights
2022 Key Highlights: Best Year Ever
Record results driven by strong customer focus, broad business portfolio and operational discipline
Sales
16,067 €M
12,736 €M in 2021
Adj. EBITDA
1,488 €M
+52% vs. 2021
Net Income
509 €M
+64% vs. 2021
FCF
559 €M
+53% vs. 2021
GHG emission
-24%
-7.5%
scope 1 & 2
vs 2019 baseline
vs 2019 baseline
scope 3
vs 2019 baseline
vs 2019 baseline
CIRCULAR ECONOMY
10%
share of recycled materials
First adoption of
Integrated
Annual Report
Annual Report
Dividend proposal
0.60 €/share
€0.55 in 2021
ESG performance data
HIGHLIGHTS 2022
44.9%
WHITE-COLLAR WOMEN hired with permanent contracts vs 39% in 2021
37%
Of employees are stable shareholders (YES program) vs 35% in 2021
665,104 tCO2eq
GHG EMISSIONS
(Scope 1 and 2 Market Based)
-24% reduction vs baseline 2019
(Scope 1 and 2 Market Based)
-24% reduction vs baseline 2019
72%
Of suppliers subjected to ESG assessments vs 68% in 2021
16,719 mln €
Economic value generated and distributed vs 13,484 mln € in 2021
PEOPLE AND HUMAN RIGHTS
about 3%
of the share capital held by employees
29
training hours per head count vs almost 18 in 2021
15.7%
WOMEN EXECUTIVES
vs 13.5% in 2021
vs 13.5% in 2021
100%
of PLANTS subjected to HUMAN RIGHTS due diligence
INNOVATION AND ENVIRONMENTAL RESPONSIBILITY
71%
WASTE RECYCLED
vs 69% in 2021
vs 69% in 2021
over 53 mln €
53.3 mln € saved through the DESIGN TO COST (DTC) programme vs 48 mln € in 2021
92%
product families included in CARBON FOOTPRINT analysis vs 89% in 2021
about 16 mln €
ENVIRONMENTAL INVESTMENTS for the reduction of GHG emissions vs 15 mln € in 2021
SUSTAINABLE VALUE CHAIN
50%
re-used drums in 2022
92%
ON TIME DELIVERY in 2022
(Energy product line)
(Energy product line)
over 25 mln
users reached through ADV campaigns on network channels in 2022
+215.6%
Company’s stock with TOTAL SHAREHOLDER RETURN vs +196% in 2021
Being Prysmian
Vision, Mission, Values
VISION
We believe in the efficient, effective and sustainable supply of energy and information as the main driver for the development of community.
MISSION
The Prysmian Group provides its customers worldwide with superior cable solutions based on pioneering technology and consistent excellence in execution, ultimately delivering sustainable growth and profit.
VALUE
\ Drive - Our objective is to guide the evolution of our sector: we develop our people and our business, following a clear strategy while anticipating customer needs.
\ Trust - where diversity and collaboration are recognised and people are empowered to make decisions with integrity.
\ Simplicity - Our challenge is to simplify all that we can, focusing on activities that generate considerable value and timely decisions that enhance the results achieved by the Group.
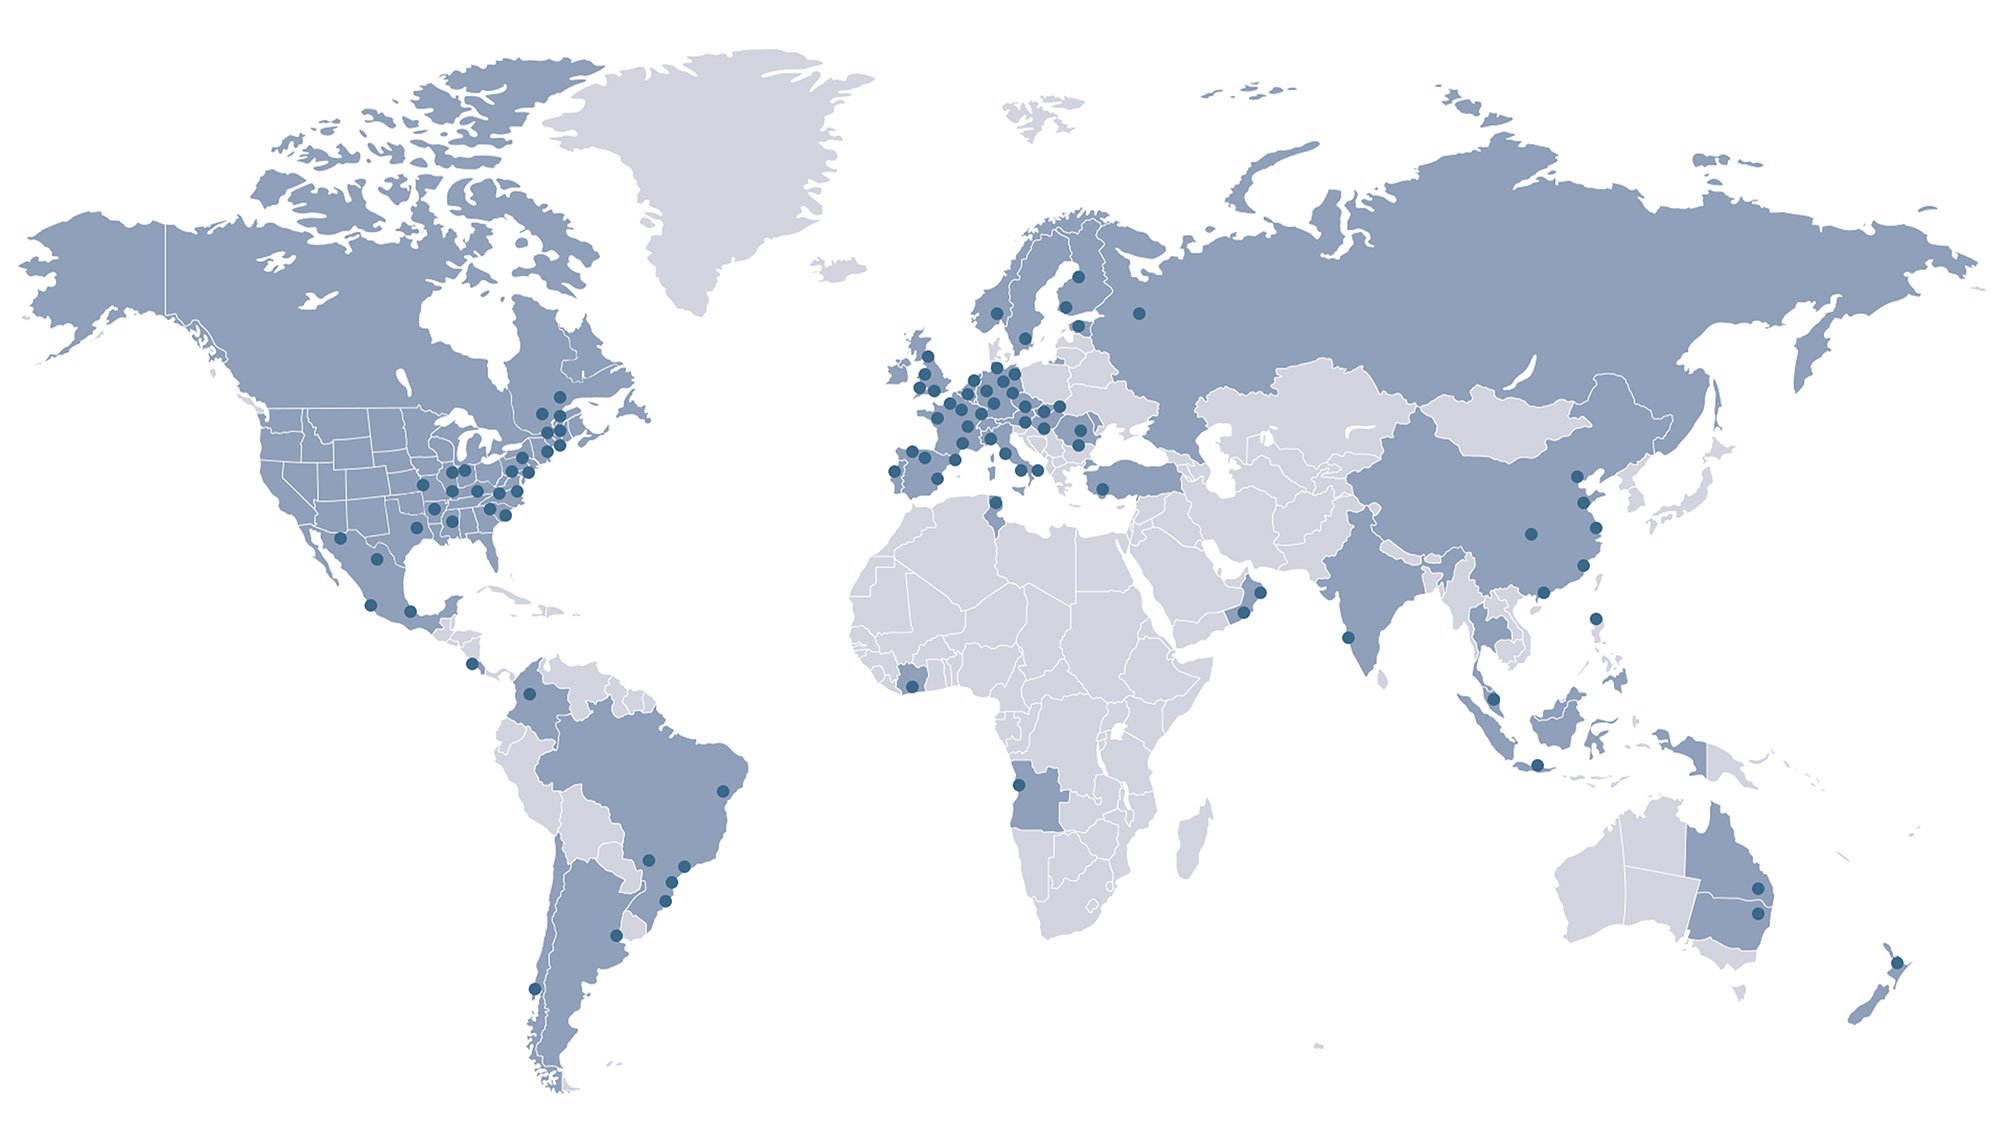
Prysmian Group Footprint
+50 countries
108 plants
5 cable-laying ships
26 R&D Centers
more than
30,000 employees
Prysmian Group Memberships
As an industry leader, Prysmian Group is called upon to play a proactive role in promptly addressing new issues that emerge and finding solutions by sharing best practices with the entire industry. Accordingly, our inclusion in industry groupings that seek to improve the sustainability of the industry is strategic for the Group.


Business Areas
Energy
This area comprises business segments offering a complete and innovative portfolio of products designed to satisfy the many needs of the markets served. This macro-area is organised as follows:
\ Energy & Infrastructure
\ Industrial & Network Components
\ Energy & Infrastructure
\ Industrial & Network Components
Projects
The Group designs, manufactures and installs high and extra-high voltage cable systems for the transmission of electricity from generating stations and within transmission and primary distribution grids.
The Projects area comprises:
\ Land and Submarine HV power cables
\ submarine cables for telecommunications
\ special cables for offshore use
The Projects area comprises:
\ Land and Submarine HV power cables
\ submarine cables for telecommunications
\ special cables for offshore use

Telecom
Prysmian Group is active in the development and manufacture of a wide range of cable systems and connectivity products used in telecommunication networks. This area comprises the following market segments:
\ Telecom Solutions
\ MMS Multimedia Specials
\ Optical fibre:
\ Telecom Solutions
\ MMS Multimedia Specials
\ Optical fibre:
Group strategy
During 2022 the world faced complex economic, social and political risks that were often interlinked, such as the war in Ukraine, the isolation of China, the slowdown in global growth and high rates of inflation, not to mention extreme climate events.
Challenges associated with energy and food supply, scarcity of raw materials and the strategic role of cyber security have prompted businesses to adopt increasingly flexible and resilient business models.
In a volatile, uncertain, complex and ambiguous world, it is essential to understand the direction of changes and turn them into opportunities for growth.
5 macro-trends are reshaping Prysmian markets

Smartization and Servitization
IoT to become pervasive in life and in business, increasing penetration of services vs. products.

Cloudification
Migration of applications from local installations to a web-based set-up

Electrification
Electricity to progressively substitute other sources of power

Increasing RES
Shift from fossil fuels to hydro, solar, wind

Data booming
Exponential increase in data consumption enabled by fixed and mobile network enhancement
Prismian's competitive advantages
Faced with these continual complex changes, Prysmian can count on a solid business model founded on the following strategic pillars:
\ DIVERSIFICATION
A broad product portfolio and diversified geographical coverage capable, respectively, of exploiting the convergence of Energy and Telecom and attenuating the cyclic nature of Prysmian's activities in the various Regions and businesses.
A broad product portfolio and diversified geographical coverage capable, respectively, of exploiting the convergence of Energy and Telecom and attenuating the cyclic nature of Prysmian's activities in the various Regions and businesses.
\ TECHNOLOGICAL EXCELLENCE
Innovative products and solutions, as well as highly qualified human capital.
Innovative products and solutions, as well as highly qualified human capital.
\ DECENTRALISED SUPPLY CHAIN
A decentralised supply chain capable of delivering customised solutions.
A decentralised supply chain capable of delivering customised solutions.
\ AGGREGATION HUB
Ability to complete acquisitions and mergers, releasing major cost and revenue synergies.
Ability to complete acquisitions and mergers, releasing major cost and revenue synergies.
Prepared for the future
Leveraging these solid competitive advantages, the Prysmian strategy is focused on the following growth opportunities:
\ THE CONSOLIDATION OF LEADERSHIP
Long-term, structural growth in core areas (e.g. interconnections, network reinforcement, FTTx).
Long-term, structural growth in core areas (e.g. interconnections, network reinforcement, FTTx).
\ RESEARCH AND DEVELOPMENT FOR INNOVATION
Development of skills and the product portfolio in sectors undergoing rapid expansion, such as Solar, Wind, EV Charging, Data Centres and 5G.
Development of skills and the product portfolio in sectors undergoing rapid expansion, such as Solar, Wind, EV Charging, Data Centres and 5G.
\ SOLUTION PROVIDER
Turnkey services for the energy transition and digitalisation.
Turnkey services for the energy transition and digitalisation.
Corporate Governance
As part of work to improve constantly the sustainability of business activities and the related communications to stakeholders, in 2022 Prysmian Group defined a new governance model that clarifies the roles and responsibilities of all actors:
The responsibility of the Chief Sustainability Officer is to:
\ guide creation of the ESG Strategy, define targets and set priorities by developing the Group's Materiality Matrix;
\ support the Regions and business units in implementing actions and initiatives designed to achieve the Group's sustainability goals;
\ manage the Sustainability Indices;
\ ensure that stakeholder engagement activities are carried out;
\ lead the internal Sustainability Steering Committee and the Network of Local Sustainability Ambassadors;
\ serve as Secretary of the Board's Sustainability Committee;
\ support the Administration, Finance and Control Department to prepare the Integrated Annual Report;
\ oversee determination of the contents of the Sustainability Report.
The responsibilities of the Group Planning and Control and Group Administration functions are to:
\ monitor the performance of ESG KPIs;
\ coordinate the collection of non-financial data;
\ prepare the Integrated Annual Report;
\ verify the accuracy and quality of data.
The responsibilities of the Communication and Public Affairs Division are to:
\ develop communication campaigns;
\ help the CSO to organise stakeholder engagement events.
The Sustainability Committee, established by the Board of Directors, has the responsibilities detailed in the section on “The structure of Corporate Governance”.
The responsibilities of the internal Sustainability Steering Committee, headed by the Chief Sustainability Officer and comprising representatives of the various corporate functions, are to:
\ develop objectives and targets and submit them to the Group Leadership Team;
\ support the Chief Sustainability Officer in the creation of the Materiality Matrix;
\ propose actions to be implemented at Region, BU and function level;
\ monitor and follow-up the sustainability KPIs and results.
Regional and BU leadership teams play a key role with regard to the Group's sustainability commitments.
The Network of Local Sustainability Ambassadors was established to promote a culture of sustainability, related initiatives and glocal ESG actions at regional level.
Sharing Value,
Group Performance and Results
Ownership structure
Financial Market Performance
The average share price during 2022 was Euro 30.69, up from Euro 29.87 in 2021. Including dividend pay-outs, the Total Shareholder Return (TSR) offered by the Prysmian stock was +6.6% in 2022 and +215.6% since its original listing on 3 May 2007. Excluding the contribution of dividends and so just considering price changes, the performance was +4.7% in 2022 and +125.6% since the listing date.
Being Sustainable
Impact Model
The Group's sustainability strategy is based on an “Impact Creation” model, enabling effectiveness to be analysed and areas for improvement to be identified in a timely and measurable manner.
The model comprises four macro-areas interconnected to one each other in a circular way:
\ The first area, Prysmian's value chain, describes the Group's identity and activities;
\ The second area identifies the actual and potential impacts, both positive and negative, generated by Prysmian throughout its entire value chain (see the “Materiality analysis 2022” section for more information);
\ The third area involves measuring and monitoring constantly the KPIs that Prysmian has defined within its sustainable development strategy;
\ The fourth area comprises the environmental and social ambitions identified by the Group as a tangible response to these impacts, via continuous innovation of products and processes.
The four areas, interconnected in a circular way, describe:
\ IMPACTS
Positive or negative, actual or potential, short/medium or long-term impacts generated by Prysmian throughout the entire value chain and suffered in connection with specific financial indicators;
Positive or negative, actual or potential, short/medium or long-term impacts generated by Prysmian throughout the entire value chain and suffered in connection with specific financial indicators;
\ LONG-TERM AMBITIONS
Defined by Prysmian as concrete responses to these impacts.
Defined by Prysmian as concrete responses to these impacts.
Sustainability Priorities
Climate Change & Social Ambition
2030 Social Ambition Targets
Reducing our Customer's CO2
Digitalizing the Supply Chain
Visibility over cable-related emissions & Optimization in the usage & transportation
First Eco Label in the Industry
6 measurable and recognized sustainability criteria in line with the EU Eco-label’s
Recyclability of materials
Offering full recyclability and superior transmission performances

PryID
RFID technology to the full suite of critical information including cable type, length, origin
Digital Sales
A place for Prysmian’s customers to market their leftovers & facilitates the reuse of short lengths

Cable Coating Technologies
Increased transmission efficiency, Sustainability boost, reduce costs, increased safety and resilience

Monitoring and Sensing
Preventing equipment failures and extend components’ life

MV Splicing Robot
Working prototype by 2024
Sustainable Innovation
Through sustainability and innovation, the Group is strongly committed to finding new solutions, materials and processes that bring benefits.
In fact, being an enabler of energy transition and digitalisation means having the ability to innovate constantly.
Innovation is the driver that defines and underpins all of the Group’s social and environmental ambitions.
Innovation and sustainability are inextricably bound together, requiring Prysmian to adopt a holistic and integrated approach: efforts in innovation strengthen the commitment to achieving the long- term targets set.
Sustainability is now embedded in the creation of value for customers, making it tangible and visible, through the development of innovative, green solutions.
2022 Numbers
114
million euros
invested in R&D
invested in R&D
5,800
patens covering
the main innovations
the main innovations
26
research centres
250
product families
launched in 2022
launched in 2022
50
collaborations with
research centres and universities
research centres and universities
1,000
professionals
Sustainability Scorecard
In order to establish a credible path to sustainability, Prysmian Group has set specific targets so that progress can be monitored constantly that include long-term targets as well as short-term goals.
SCORECARD PRYSMIAN GROUP 2020-2022
SDGs
KPI
Baseline
2019
2019
2020
2021
2022
Target
2022
2022
Percentage of product families covered by
the carbon footprint measurement
the carbon footprint measurement
70%
84%
89%
92%
85%
48% to 50%
-16 % to -21%
-3%
95%
65%
Maintain
30
20%
67% to 70%
59% to 65%
30 hours
14% to 18%
40%
IF: 1.2
IG: 41
Percentage of annual revenues from low
carbon-enabling products
carbon-enabling products
48%
48%
44%
45%
Percentage reduction in the emissions of greenhouse gases (Scopes 1 and 2 Market Based)
870 ktCO2
-17.4%
-22.1%
-24%
Percentage reduction in energy consumption
9,845 TJ
-6%
-2.9%
-7.7%
Percentage of plants certified ISO 14001
83%
83%
90%
97%
Percentage of waste recycled
63%
69%
69%
71%
Percentage of drums (tonnes) reused during the year
46%
48%
50%
50%
Number of sustainability audits carried out based on risks in the supply chain
15
22
27
30
Percentage of cables assessed using Ecolabel criteria developed internally by Prysmian
0%
1%
20.9%
37%
Employee Engagement Index (EI)
65%
65%
60%
61%
Leadership Impact Index (LI)
57%
57%
54%
55%
Average hours of training per employee each year
26 hours
18 hours
18 hours
29 hours
Percentage of women executives
12%
13%
13.5%
15.7%
Percentage of white-collar women hired permanent contracts
33%
34%
39%
44.9%
Frequency rate (IF) - Internal employees
Frequency rate (IF) - Internal and external employees
Frequency rate (IF) - Internal and external employees
IF: 1.30
IF: 1.31
IF: 1.31
IF:1.30
IF: 1.25
IF: 1.25
IF:1.49
IF: 1.55
IF: 1.55
IF: 1.32
IF: 1.40
IF: 1.40
Severity rate (IG)
Internal employees
Severity rate (IG)
Internal and external employees
Internal employees
Severity rate (IG)
Internal and external employees
IG: 41.54
IG: 41.94
IG: 41.94
IG:46.40
IG: 44.76
IG: 44.76
IG: 46.98
IG: 47.19
IG: 47.19
IG: 54.20
IG: 53.46
IG: 53.46
New Sustainability Scorecard
In order to establish a credible path to sustainability, Prysmian Group has set specific targets so that progress can be monitored constantly that include long-term targets as well as short-term goals.
SCORECARD PRYSMIAN GROUP 2023-2025
SDGs
Category
KPI
Baseline 2022
Target 2025
Impacts on Society
Enable access to green electricity to households
21m
110m
3m
15m
Enable fast digital access to households
Climate
Percentage reduction of GHG emissions (Scope 1&2 Marked Based) vs 2019 baseline
-24%
-35%/-37%
Percentage reduction of Scope 3 GHG Emissions vs 2019 baseline
-7.5%
-11.5%/-15%
Green & Circular Economy
Share of revenues linked to Sustainable Products – in EU/RoW
52%/5%
57%/19%
Share of recycled content on PE jackets and copper
10%
15%/16%
Diversity & Inclusion
Percentage of Desk Workers women hired
44.9%
47%/49%
Percentage of Executive women
15.7%
21%/24%
People Wellbeing
Safety Assessment Plan
-
2.75/5
Leadership Impact Index
55%
57%/61%
Solid Governance
& Ownership
& Ownership
Percentage of shareholders employees
37%
44%/45%
Completion rate for compliance e-trainings promoting anticorruption
75%
90%
Prysmian Group in the ESG indices
INDEX
DESCRIPTION
2020
2021
2022

The DJSI is based on an analysis of business performance using 24 criteria divided into three main categories: environment, social and corporate governance. These categories are further divided into more specific subcategories. Ratings range from 0 to 100.
Rank: 87/100 (ELQ World) included and ranked as 2nd
Rank: 87/100 (ELQ World) included and ranked as 1st
Rank: 87/100 (ELQ World) included and ranked as 3rd
The MSCI ESG Ratings seek to measure the resilience of a company to long-term and financially significant ESG risks. The ESG ratings range from leader (AAA, AA), average (A,BBB, BB) to laggard (B, CCC).
Score: A
Score: AA
Score: AA
EcoVadis is a platform that allows companies to monitor the sustainability performance of suppliers through an assessment. The overall score (0-100) reflects the quality of the company’s sustainability management system at the time of the assessment. Criteria for the 2023 scorecards:
- Platinum: overall score between 78 and 100;
- Gold: overall score between 70 and 77;
- Silver: overall score between 59 and 69;
- Bronze: overall score between 50 and 58.
- Platinum: overall score between 78 and 100;
- Gold: overall score between 70 and 77;
- Silver: overall score between 59 and 69;
- Bronze: overall score between 50 and 58.
Score: 76/100 (Platinum)
Score: 73/100 (Platinum)
Score: 74/100 (Gold)
CDP is the most well-known NGO in the world when it comes to assessing the transparency of climate-change disclosures, with the assignment to firms of scores from D to A. The scoring methodology is aligned with theTask force for Climate-related Financial Disclosures (TCFD) and the main environmental standards, thus providing the entire market with a set of comparative data.
Score Climate
Change:B (World)
Score Water
Security:C
Change:B (World)
Score Water
Security:C
Score Climate Change:B (World)
Score Water Security:B
Score Water Security:B
Score Climate Change:A (World) Score Water Security:B
The ESG Risk Rating provides an overall score for the firm based on an assessment of how much it is exposed to ESG risks and how they are managed. The scale ranges from 0 (low risk) to 40 (high risk).
Risk: 26.1 (Medium)
Risk: 22.8 (Medium)
Risk: 21.4 (Medium)
The FTSE4Good Index Series are equity indices launched in 2001 by the FTSE Group to measure the performance of companies that demonstrate solid Environmental, Social and Governance (ESG) practices. Companies must have an overall ESG rating of at least 3.3/5 for inclusion in the FTSE4Good indices.
Score: 4.0/5
Score: 3.8/5
Score: 3.8/5
Bloomberg collects Environmental, Social and Governance data from corporate public communications. Bloomberg ESG Disclosure Scores evaluates companies on the basis of their disclosure of ESG data, in consideration of the relevant industries. The rating scale ranges from 0 to 100.
Score: 45/100
Score: 55/100
Score: 63/100
The Stoxx ESG Indices are a new group of indices. Their ratings are based on specific environmental, social and governance performance indicators in addition to overall sustainability performance.
Included (STOXX Italy 45 ESG-X and
STOXX Europe 600 ESG-X)
STOXX Europe 600 ESG-X)
Included (STOXX Italy 45 ESG-X and
STOXX Europe 600 ESG-X)
STOXX Europe 600 ESG-X)
Included (STOXX Italy 45 ESG-X and
STOXX Europe 600 ESG-X)
STOXX Europe 600 ESG-X)
Launched by Euronext, the MIB® ESG index is the firstESG index dedicated to Italian blue chips. It combines the measurement of economic performance with ESG assessments in line with the principles of the UN Global Compact2. The composition of the index is based on the analysis of ESG criteria by Vigeo Eiris (V.E.), part of Moody's ESG Solutions, which assesses the ESG performance of issuers. The methodology behind the index uses ESG criteria to rank the 40 best from the 60 most liquid Italian companies, excluding those involved in activities not compatible with ESG investments.
Included
Included
Carbon Clean 200 is a report produced by Corporate Knights that classifies 200 leading firms in terms of their clean energy sales.
Rank: 47/200
Rank: 58/200
Rank: 58/200

Moody's ESG solutions seek to understand better the ESG performance of the organisation, assess its exposure to climate and environmental risks, strengthen its actionplans in the area of sustainability and communicate with the main Stakeholders. The index assesses sustainability performance using 25 criteria, subdivided into 6 different areas: environment, human resources, human rights, community involvement, ethical conduct and governance. The rating scale ranges from 0 to 100.
Rank: 44/100
Rank: 51/100
Rank: 57/100
Stakeholder Engagement Activities
Creating value for stakeholders is an essential element of the Prysmian Group's Sustainability Strategy. The goal is to understand the stakeholders needs, interests and expectations, anticipate changes and emerging trends, enabling the Group to pursue its sustainable development objectives and create shared and constant value in the long term.
This commitment is reflected in stakeholder engagement projects and activities throughout the value chain, with active listening, the promotion of sustainable behaviours and the creation of innovative, green products and services capable of meeting their needs and expectations (see the “Sustainable innovation for products, applications and processes” section of this document for more about sustainable products and services and the related risks).
The total economic value generated, being the overall wealth created by the Group for all stakeholders, amounted to Euro 16,719 million in 2022. Much of this value, Euro 16,211 million, was redistributed in the form of:
Dialogue with the Group's Stakeholders
Creating shared value means developing and cultivating an ongoing dialogue with stakeholders to create a relationship based on trust.
The goal is to understand the stakeholders needs, interests and expectations, anticipate changes and emerging trends, enabling the Group to pursue its sustainable development objectives and create shared and constant value in the long term.
RELEVANCE FOR STAKEHOLDER
Prysmian Group Sustainability Week;
Topic workshops;
External Stakeholder Survey;
Interviews with major investors.
RELEVANCE FOR PRYSMIAN GROUP
Interview with Top Executives;
Senior Leaders survey;
Sustainability Steering Committee.
DNF Consolidated Non Financial Disclosure
Materiality Assessment
The new GRI approach to materiality analysis has led Prysmian to identify 10 material topics that remain consistent with those reported previously. The 10 material topics, indicated in the table below, were tested by the Group’s stakeholders and prioritised according to their importance, with the following result:
Material Topic
Definition
Relevance
Enabling the decarbonization to Net-Zero and digitalization
Policies and actions to reduce energy consumption and accelerate the race to net-zero CO2 emission by setting science-based carbon reduction targets for the Group.
Sustainable innovation for products, applications and processes
Development of solutions that may generate sustainability benefits (e.g. solutions for plants that generate renewable energy, smart grids, innovatives olutions for the electrical system) and continuous research linked to the development of sustainable products and processes, considering the environmental and social impact of the product throughout its entire life cycle.
Governance, ethics and integrity
Governance organization and mechanisms designed to ensure the fair and transparent management of business activities and the involvement of employees, management and shareholders, partly via the share ownership plan reserved for employees. Business management model based on the most stringent standards of business ethics and integrity, especially with regard to the measures adopted by the Group to prevent both active and passive corruption and to ensure right tax practices.
Human capital’s well-being, engagement & upskilling
Well-being intended in a wide sense, including:
- well-being at work through health and safety management systems aimed at reducing the number of accidents and occupational diseases and
- policies and actions put in place to attract talents and ensure the development of human resources, such as training and mentoring programs, wage policies, bonus and benefit policies, career plans, long-term incentives and promotion of physical and emotional well-being.
Efficient, sustainable and circular operations
Efficient management of the business operations related to the environmental impacts generated and to the circularity granted by the recycling activity.
Sustainable value chain
Promotion of a long-term value creation throughout a sustainable management of the whole value chain focusing on both upstream (with refer to the relevance of the relationship with Prysmian Group’s suppliers) and downstream activities (clients are a key source for Prysmian, therefore a sustainable value chain involves the “client centricity” approach). The value creation considers both the economic performance and sustainability of the value chain which is deeply intertwined with suppliers and customers.
Greater diversity, inclusion & respect for human rights
Promotion of multiculturalism, social and digital inclusion, protection of diversity in the workplace, reduction of disparities in living wages alongside the definition of policies and practices to protect human rights along the whole value chain.
Impacts on local communities
Group's activities to promote energy and telecommunications access for everyone; sponsorship and donations for the development of the local community in order to create a positive impact.
Cyber security and data protection
Enhanced cyber security measures to manage information security risks and ensure the protection of data and privacy.
Biodiversity and impacts on nature
Awareness of Group’s impact on ecosystems and of the consequences that the loss of biodiversity has on the business and in the areas in which the Group operates.
Environmental responsability
This section analyses the Group’s environmental performance from various perspectives, from the energy used to emission, from water use to waste produced and the protection of biodiversity.
energy consumption - obtained as the sum of all energy sources used in manufacturing and service activities.
biodiversity - the impact of operations on the natural habitats in which the Group operates.
water consumption - which is significant due to the large volumes needed for cooling in the various production cycles.
hazardous and non-hazardous waste - significant for its potential impacts on the various environmental matrices, depending on the processes of origin and disposal methods, but for some categories process efficiency is also relevant.
emissions of greenhouse gases - primarily linked to the use of sources of energy and, to a very limited extent, to the use of greenhouse gases at certain stages of production.
recycled waste – hazardous and non-hazardous - increasing the percentage of recycled waste helps reduce the environmental impact associated with waste disposal operations.
circular economy - using fewer resources to manufacture it products and keeping materials within the production cycle as long as possible.
Energy consumption
The Group’s total energy consumption, as reported in the following table, includes that one of its fleet vehicles.
For this reason the comparative figures for 2021 and 2020 differs slightly from those reported in the published Consolidated Non-financial statement 2021, in which the fleet data was presented separately.
Energy Consumed (GJ)
Total 2022
Total 2021
Total 2020
Total
9,971,915
10,020,131
9,741,919
Energy Consumed per km/Ton of product
Power cables GJ/Tonne
Telecom cables GJ/km
Optical fibre GJ/km
Wire rods /Tonne
2022
3.57
0.01
0.04
2.05
Water consumption
Water drawn (m3)
Total 2022
Total 2021
Total 2020
Total
7,761,474
8,642,130
8,847,815
Waste
Waste produced by type (kg)
Total 2022
Total 2021
Total 2020
Hazardous
14,050,194
13,924,252
11,153,661
Non-hazardous
220,355,520
199,677,575
180,577,201
Total
234,405,714
213,601,827
191,730,862
Greenhouse gas emissions
Emissions of tCO2
Total 2022
Total 2021
Total 2020
Scope 1
Direct emissions from combustion
232,178
216,874
219,519
Emissions from refrigerant gas leaks
3,696
7,047
7,626
Emissions from SF6 gas leaks
61,852
117,186
108,610
Total Scope 1
297,725
341,107
335,755
Scope 2
Location-based
501,745
512,458
519,589
Market-based
367,379
365,862
422,675
Total
Scope 1 and Scope 2 (Location-based)
799,470
853,565
855,344
Scope 1 and Scope 2 (Market-based)
665,104
706,969
758,430
Scope 3
269,684,778
284,562,292
291,462,668
Biodiversity
The environmental aspects potentially impacted by Prysmian, with possible adverse consequences for the condition of the biosphere, include the biodiversity of animal and plant species.
The various environmental analyses carried out at site level show that Prysmian has no potential significant impact on biodiversity.
Nevertheless, Prysmian seeks to plan activities that are respectful of natural habitats, in order to maintain their equilibrium without adversely affecting any of the biological functions of the areas selected for operations, whether on land or at sea, while restoring any habitats that are adversely affected by those activities.
This undertaking involves carrying out prior feasibility analyses of new plants and monitoring protected areas in the territories in which the Group operates, considering such aspects as local legislation on biodiversity and the geographical proximity of its plants to protected area or where potentially endangered species are present.
Circular Economy
Circular Economy Prysmian is committed to implementing circular economy practices to reduce its environmental impact, using fewer resources to manufacture it products and keeping materials within the production cycle as long as possible.
The Group’s approach to circularity addresses three main aspects: Procurement of recycled materials Minimisation of scrap materialsRecycling of waste downstream of the plants
People and Human Rights
Prysmian Group strives constantly to ensure ethical and responsible conduct throughout the entire value chain.
Its solid documentary framework, from the Code of Ethics to the Anti-corruption and Helpline Policies, means that daily business can dedicate particular attention to environmental and social matters, with a special focus on human rights.
Prysmian Group no. at 31.12.2022
White Collar+executives
Blue Collar
Total 2022
Total
8,219
21,966
30,185
White Collar+executives
Blue Collar
Total 2022
Number of employees
24,376
5,809
30,185
Gender Balance
PRYSMIAN GROUP’S OBJECTIVES FOR IMPROVING GENDER BALANCE
Group
(actual 2022)
(actual 2022)
Side by Side
Target Group (2022)
Target Group (2022)
Percentage of women in the Total Workforce
19.2%
17%-19%
Percentage of White Collar women hired
44.9%
40%
Percentage of women in Junior Management positions
26.9%
27% to 29%
Percentage of women in Middle Management positions
24.4%
25% to 27%
Percentage of women in all Executive positions
15.7%
14% to 18%
Percentage of women in Top Management positions
7.1%
10% to 12%
Percentage of women in all Management positions
24.3%
25% to 27%
Percentage of women in Management positions in Revenue-generating Functions
17.4%
17% to 19%
Percentage of women in STEM position
19.7%
19%-20%
Gender Pay Gap
A Gender Pay Gap Analysis of the entire population of desk-workers identified areas for improvement and a related action plan, which was progressed during 2022. The results of the analysis carried out, expressing the male/female wages-salary ratio in percentage terms by job grade and geographical area, are shown below:
GROUP GENDER PAY GAP ANALYSIS
2022
EMEA
North America
LATAM
APAC
Total
Executive
7%
3%
3%
21%
7%
Managerial positions
2%
6%
4%
13%
4%
Employees
2%
2%
4%
10%
4%
Total
2%
3%
4%
10%
4%
Talent
The training and development of Prysmian Group’s personnel expanded in a structured manner during 2022, with a global increase in training hours per FTE of about 60% (from 18 to 29) compared with the prior year.
This trend follows the growth objectives for training linked to Social Ambition 2030, without however losing sight of its impact on needs, or the traceability and validation of the related data, which have equal importance
HOURS OF TRAINING DELIVERED
Men
Women
Total
White collar + Executives
140.424
87.455
227.879
Blue collar
552.235
90.187
642.539
Total
692.776
177.642
870.418
The total average hours of training per employee in 2022 was 29, a sharp increase compared to the previous years 2020 and 2021 where there were 18 average hours of training per employee.
Average hours of local + Academy training - Prysmian Group 2022
Professional category
Men
Women
Total
White collar + Executives
25
34
28
Blue collar
29
30
29
Total
28
32
29
Human rights due diligence
Prysmian strives with passion to respect and safeguard the human rights of all employees and all those affected by our activities to ensure that the Group is not involved in any way, either directly or indirectly, in activities that violate human rights.
With this objective in mind, the Group Human Rights Policy was introduced in 2017.
This policy is based on various international standards (such as the Universal Declaration of Human Rights, the ILO Declaration on Fundamental Principles and Rights at Work, the United Nations Global Compact, etc.) and applied at all locations and in all Prysmian activities.

ASSESS
Assessmentof the current and potential impact on Human Rights, considering the risk of violations at country and plant level, identified using desk analysis and self-assessment tools

ACT
Assessment of the results and performance of audits at high-risk plants; definition of necessary actions to prevent and/or mitigate the potential impact identified
MONITOR
Monitoring of performance via checks and audits over a period of years

RESOLVE
Resolution of violations

COMMUNICATE
Communication of performance in the Sustainability Report
Safety
The Group has a Policy for Health, Safety, the Environment and Energy that guarantees a commitment to compliance with good management procedures to ensure a safe workplace.
2022 key figures:
Prysmian Group 2022
Group (total)
Prysmian employees
Temporary agency workers
Contractors
Severity rate
53.46
54.20
44.12
31.56
Frequency rate
1.40
1.32
2.39
1.02
Hours worked
59,933,731
54,582,051
4,351,680
8,814,534
Commitment to the Communities
Creating value for stakeholders means directly involving people, not just employees, but also the communities and territories in which the business operates and interacts, consistent with our Values, Mission and Vision.
One of the drivers of the sustainability strategy that has characterised the Prysmian Group over the years is “Local Community Involvement”, thus contributing via various initiatives to the socio-economic development of the territories in which we operate
Sustainable Value Chain
Prysmian’s supply chain plays a decisive role in the business and the sustainability strategy of the Group. On the one hand, it endeavours to keep plant capacity saturated and eliminate production bottlenecks while, on the other, it guarantees a competitive advantage thanks to the careful selection of suppliers in ESG terms and constant engagement with them, by forging long- term partnerships.
MATERIAL USED BY WEIGHT OR VOLUME (KTON)
2022
2021
2020
Metals
1,219
1,189
1,083
Compounds
365
374
339
Ingredients
288
299
276
Chemical products
6
6
6
Other (yarns, tapes and oils)
26
25
23
Total
1,904
1,893
1,727
NEGATIVE SOCIAL IMPACTS IN THE SUPPLY CHAIN AND ACTIONS TAKEN
NEGATIVE ENVIRONMENTAL IMPACTS IN THE SUPPLY CHAIN AND ACTIONS TAKEN
Group’s logistics and transport
In 2021 Prysmian Group continued its commitment to optimizing the transport of goods.
In a year when there were severe issues and supply stress, the Group benefited from a predominantly local supply chain. Its international reach also proved advantageous, as it allowed the company to anticipate localized issues.
The main issues monitored include the cost of sea transport and transport costs in general and the difficulty in finding extra volumes of metals.
METHODS OF TRANSPORTATION
Types of transport by percentage (based on expenditure)
FY 2022
FY 2021
FY 2020
FY 2019
FY 2018
FY 2017
Air
2.8%
3.0%
2.0%
3.0%
3.6%
3.5%
Sea
12.8%
7.5%
8.3%
10.0%
6.9%
7.0%
Ground
84.3%
89.5%
89.7%
87.0%
89.5%
89.5%
Ethics & Integrity
Prysmian Group’s Tax strategy is based on the following principles:
COMPLIANCE: conformity with the tax laws, regulations and circulars issued by the tax authorities.
LEGALITY: satisfaction by all Group companies of their tax and tax payment obligations.
SUSTAINABILITY: efficient, effective and sustainable management of the tax variable, in order to support the Prysmian business and, like all other aspects of our business operations, maximize shareholder value.
TRUST AND TRANSPARENCY: positive and transparent approach to the tax authorities, in order to develop and maintain fair and honest relations.
EQUITY: diligent exercise of professional judgement in order to ensure that all tax decisions are consistent with domestic and international best practices, following proper analysis and with appropriate documentation.
Cybersecurity: Protect Sensitive And Strategic Data
Creating value for our stakeholders also means protecting their personal and sensitive data and adopting operational procedures that preserve and leverage the wealth of information owned by the Group
Risk Management
Prysmian Group’s risk model
Strategic
Macroeconomic and demand trends &Competitive environment
Stakeholder expectations andCorporate Social Responsibility
Key customers & business partners
Emerging country risk
Law & regulation evolution
Research & Development
M&A / JVs and integration process
Operating CAPEXS
Strategy implementation
Organisational framework & governance
Financial
Commodity price volatility
Exchange rate volatility
Commodity interestrate volatility
Financial instruments
Credit Risk
Liquidy risk / Working Capital risk
Capital availability / cost risk
Financial counterparties
Operational
Sales & Tendering
Production Capaccity / Efficiency
Supply Chain Capacity / Efficiency
Business interruption / Catastrophic events
Contract execution / Liabilities
Product quality/Liabilities
Environmental
Information Technology
Human Resources
Outsourcing
Legal & Compliance
lntellectual Property rights
Compliance with laws and regulations
Compliance with Code of Ethics, Policies & Procedures
Planning & Reporting
Budgeting & Strategic planning
Tax & Financial planning
Management reporting - Financial reporting
European Taxonomy
The proportion of the Group’s Taxonomy-eligible and -aligned economic activities was calculated with respect to Turnover, CapEx and OpEx as follows:


